¶ MMHP Oil-Pressure Measurement: Milliseconds, Not Averages
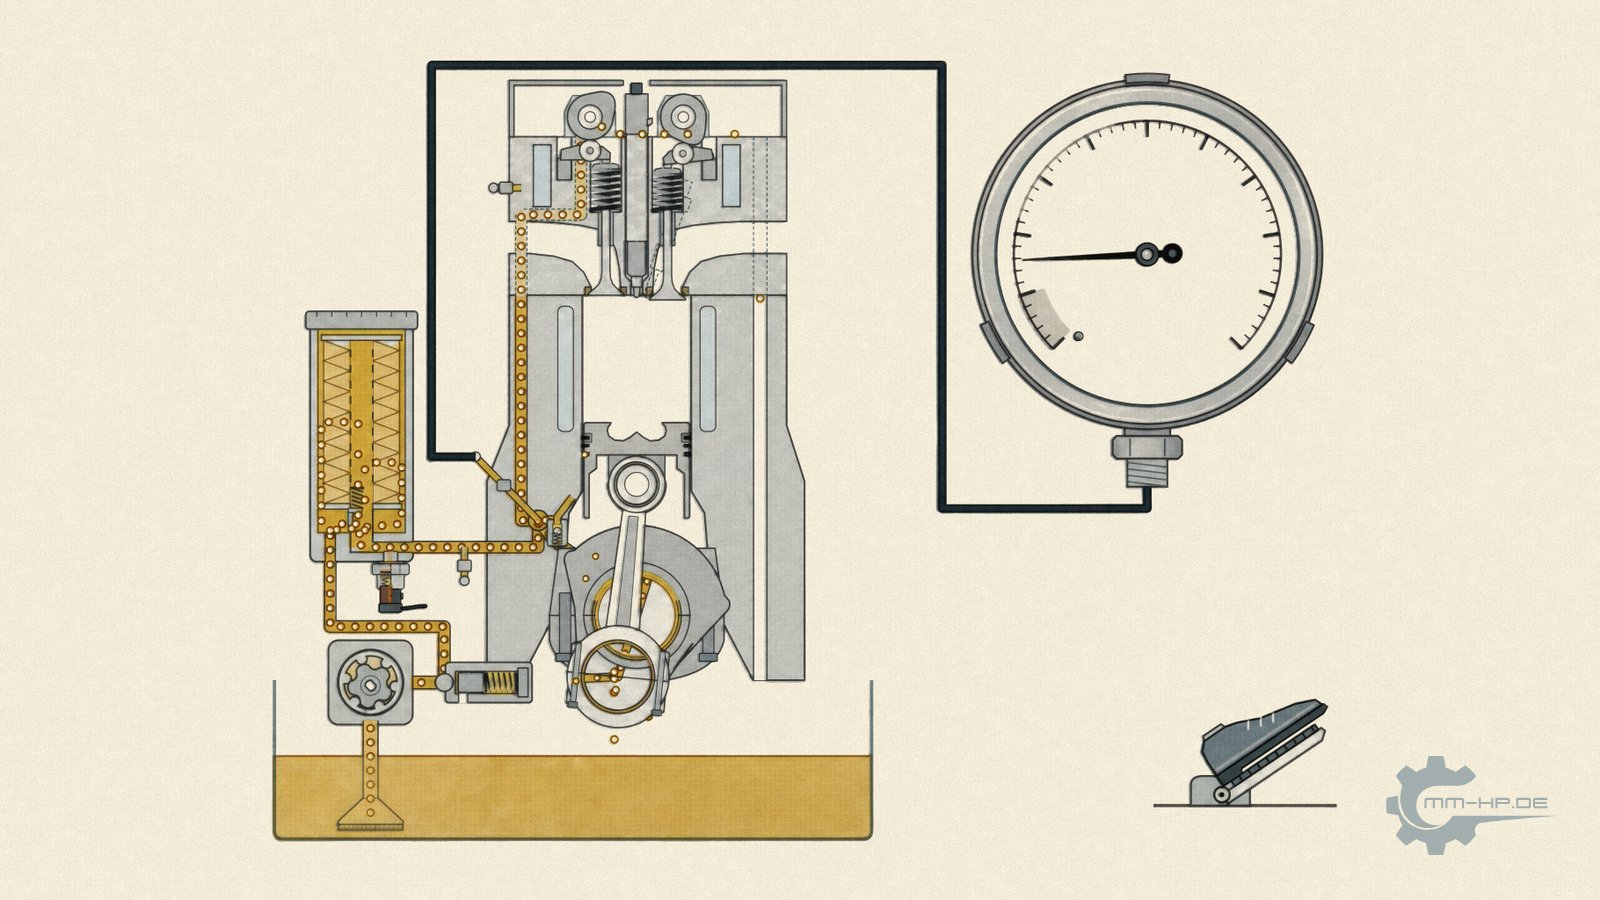
Schematic. The animation is further down in this article.
¶ The key points at a glance
When we started systematically investigating the oil supply of VW TDI engines, we first did what anyone would do: look for ready-made measurement technology. The result was sobering. Workshop test equipment is too slow and too imprecise for dynamic processes, while professional test-bench technology from engine development can do everything we needed in principle, but it is built for test cells, not for working on customer engines and test vehicles in real-world operation. A system that answered our questions simply didn't exist to buy. So we built one ourselves, hardware and software.
Our measurement system records oil pressure at multiple positions in the engine simultaneously, at millisecond resolution, time-synchronised with engine speed, oil temperature and other operating parameters. From the raw data, our evaluation software generates digital pressure traces: curves instead of single values, positions compared against each other instead of one single gauge reading, measurement series overlaid instead of snapshots read off a dial. Measurements are taken under controlled conditions, within defined temperature windows and with documented load profiles, because only that makes measurements comparable with one another. These series are also the basis for our internal comparison metric, the VHFI.
You won't see any of this technology in everyday life, but it is behind every product we make: pump sizes, gear ratios and the assessment of factory weak points are based, for us, on measurements, not assumptions.
The long version covers why the search for off-the-shelf technology failed, what the system has to be able to do, what millisecond resolution actually reveals, and how mountains of curves eventually turn into a purchasing recommendation.
¶ The search that led nowhere
Our measurement technology didn't start with a desire to invent something, but with an awkward gap. The questions our development work had to answer sounded harmless: how does pressure actually distribute across this engine's supply chain in reality? What happens at the critical passages during a load change? How does the picture change with oil temperature and mileage? Yet for every available equipment class, these questions were either too fine-grained or too impractical.
The workshop side of the market, from test kits to retrofittable auxiliary gauges, fails because of the physics of its dial mechanisms: damped, sluggish, uncalibrated, one measuring point, no recording — we dissected this in detail here. With that, you can establish WHETHER an engine has pressure. Nothing more. Just how far apart the two worlds are is something you can try out for yourself there, in an interactive graphic. The instructive moment comes when you drag the pressure downwards: the tolerance band of the pointer instrument then becomes wider than the entire pressure activity our measurement chain resolves in the same span of time.
The professional side, the measurement technology used in engine development, can in principle do everything we needed: piezoresistive sensors resolving from static conditions up into the kilohertz range, data acquisition capturing tens of thousands of readings per second, hundreds of synchronous channels. But this technology lives in test cells. It is built for conditioned environments, permanently installed units and project budgets where a single measurement setup costs more than an entire development year costs us. It was never designed for our reality: changing test subjects, real vehicles on real roads, engines in their installed position rather than mounted on a test rig.
Between these two worlds lay exactly the gap our work operates in. And after enough attempts to bridge it with compromises, the decision came that, in hindsight, seems inevitable: build it ourselves. Hardware and software, tailored precisely to our questions.
¶ The requirements profile: five things no off-the-shelf set offered
What the system had to be able to do followed directly from the questions everything else had failed to answer:
- Multiple pressure measuring points at once. Not one convenient connection point, but deliberately chosen positions along the supply chain, from the pump towards the bearing gallery, because pressure is different at every station, and those differences ARE the information.
- Millisecond resolution. The events that determine an engine's service life are fast — more on that shortly.
- Everything synchronised on one timeline. Pressure channels, engine speed, oil temperature, engine temperature and other operating parameters must sit on the same time grid, otherwise cause and effect cannot be separated.
- Operation on the real engine. In the vehicle, in its installed position, over hours, robust against heat, vibration and everyday use — not just in the test cell.
- Evaluation software that can handle mountains of data. Measuring this way produces millions of values per test run. Without software that turns this into readable pictures, you would end up with nothing but a very expensive data graveyard.
We deliberately stay tight-lipped about the concrete system specifications: channel counts, sampling rates, sensor types. This design is a core part of our development methodology, refined over years, and exactly the kind of knowledge that constitutes our company's value. We ask for your understanding in protecting it. What the system DOES, on the other hand, we are happy to describe in detail.
¶ What the system does: moments become traces
The fundamental difference from any dial-gauge measurement can be captured in one sentence: we don't read off values, we record events.
A test run produces a continuous pressure curve for every position in the oil circuit, alongside engine speed and temperatures on the same millisecond grid. Viewed this way, the engine becomes talkative: you can see how pressure at each station responds to a burst of throttle, in what order and with what delay, how the gradient between positions shifts during warm-up, and what a stretch of idling after a stint on the motorway leaves behind at the remote passages once the oil is hot and thin. A single gauge shows none of this. It averages away exactly the differences that the diagnosis depends on.

A burst of throttle: the measuring chain records the whole trace at every measuring point, with pulsation, delay and a brief dip. The gauge at point 2 only shows a damped average of it, and at warm idle it sits in the grey range below 1 bar, where the accuracy class guarantees nothing. Values schematic.
These measurement series are also where our oil-circuit simulator comes from. On our technology page you can work through the oil circuit of the 2.0 TDI as a 3D model yourself: set the engine speed, compare systems and watch where, and in which operating state, the oil pressure tips over. It shows far more than a needle at a single measuring point ever can.
The second half of the system is the evaluation software, and it does the actual translation work: it overlays measurement series, factors out temperature influences so that runs from different days become comparable, flags anomalies such as pressure drops and pulsation patterns, and condenses hours of test runs into pictures that development decisions can be based on. Software and hardware are built for each other here, and that was also a reason for developing them in-house: off-the-shelf evaluation tools would have known our questions as little as off-the-shelf measuring instruments did.
¶ Milliseconds: what you see there that nobody else sees
Why the high temporal resolution isn't an engineer's indulgence becomes clear when you look at what actually happens within an engine's oil pressure in the space of milliseconds. There is the pump's own pulsation pattern, which changes once its drive develops play — an early indicator, long before any average value drops. There are the brief pressure dips during load changes, which reveal how much reserve a system really has; two systems with the same idle average can be worlds apart here. There is the response of pressure relief and jet valves, which shows up as a characteristic signature in the trace. None of this exists for a damped dial instrument, and it is no coincidence that the professional engine world has been measuring electronically in the kilohertz range for decades — development test benches record dynamic channels at up to 50,000 readings per second. We did not invent this principle; we brought it to where it was missing for our work: to the real engine in real operation.
Rule of thumb: the average tells you how the engine felt yesterday. The milliseconds tell you how it will feel tomorrow.
¶ A look at the sensors: why "electronic" isn't just "electronic"
For anyone who wants to go deeper, a brief look into the world of pressure sensors is worthwhile, because that is where what a measurement chain can see at all gets decided. The industry knows three main designs. Piezoresistive sensors have their measuring resistors diffused directly into a silicon membrane, wired into a measuring bridge, with no adhesive in the signal path, at a sensitivity fifty to a hundred times that of metallic strain gauges, and with bandwidths reaching into the range of around 50 kilohertz. Thin-film sensors sputter their measuring bridge onto a metal base body — robust and resistant to the media involved, the industry standard for harsh environments. Capacitive sensors, finally, measure via the change in distance of a capacitor and play to their strengths at very low pressures. What all three have in common, setting them apart from the dial instrument, is that they deliver an electrical signal that can be sampled, filtered and synchronised with other channels quickly.
Just as instructive is how professionals handle the errors of these sensors — namely, like accountants. One example from the technical literature: a transmitter with an advertised base accuracy of 0.1% of full scale can reach a total error band of 0.5% in field use once temperature effects, long-term drift and digitisation are honestly factored in. The number on the datasheet is almost always the fair-weather figure. Professional measurement technology addresses this with what is known as a measurement uncertainty budget under the international GUM guideline: every source of error in the chain, from the sensor through the amplifier to the converter, is quantified individually and systematically added up into a total uncertainty. The result isn't a prettier number, but a more honest one: you know how uncertain you are. This mindset — naming errors instead of hiding them — is precisely the cultural difference between a measurement chain and a dial gauge, and it runs through all of our measurement work, right down to the persistence with which we ask about the boundary conditions when customers send us measurements.
One last technical detail, because it illustrates so well why speed alone isn't enough: in a clean chain, an anti-aliasing filter sits ahead of digitisation. It prevents signal components above half the sampling rate from appearing in the data as false phantom frequencies — an effect that can turn an under-sampled pump pulsation into a phantom signal, which we explain with a textbook example in the measuring-instruments article. You cannot see such details in the finished chart. But they decide whether the chart shows the truth.
¶ Measuring under laboratory conditions, even outside the lab
The best resolution is worthless if the boundary conditions keep shifting — comparability is a question of discipline, not technology. That's why every measurement series we run follows a fixed protocol: defined oil-temperature windows within which comparison runs take place, documented load profiles, recorded oil type and fill history, identical measuring positions across every run in a series. Only this framework turns measurements into data you can actually argue with, and it's why we ask so persistently about the measurement protocol when we receive individual readings sent in by customers.
Lab work is complemented by breadth: for questions that can only be answered under everyday operating conditions, we fit customer vehicles with measurement systems and evaluate their feedback as comparably as possible — this is how, for example, our figure for the oil-temperature reduction after conversion came about. Depth from the controlled test, breadth from the field — only together do they produce a picture we trust ourselves.
¶ From raw signal to decision: the VHFI
Every development question ends up at the same moment: two system states sit side by side as mountains of curves, factory condition against conversion, variant A against variant B, and someone has to decide which is better. But with an oil system, "better" means several things at once: delivery volume, pressure distribution across positions, stability during load changes, behaviour across the temperature window.
So that this decision doesn't end in curve-reading, we condense the measurement series into an internal metric, the Volumetric-Hydrodynamic Feed-Pressure Index, or VHFI for short. It weights these dimensions according to a formula derived from our years of experience with exactly these engines, making system states comparable at a glance, provided they were measured to the same protocol. We don't publish its exact composition, but we're glad to explain its function: it is the tool that turns measurement into decision.
¶ What this means for you
You will never hold this measurement system in your hands — it isn't one of our products, but the tool behind all of them. Yet you drive around with its result: the pump sizes chosen for our upgrade stages, the design of the gear ratios, the assessment of which factory weak point needs a fix and which is just a forum myth — all of it rests on these measurement series. When we say that a factory oil pump delivers too little under certain operating conditions, it's because we measured it, on real engines, with technology that didn't exist for this question before, and on engines we acquired and disassembled specifically for this purpose.
And if you send us your own measurement data: this is the background against which we read it. Not dismissively, but with an awareness of what a single measurement can and cannot tell you, and with a request for the details that turn a number into a statement.
¶ See also
- Why off-the-shelf oil pressure gauges don't deliver reliable results
- Oil pressure isn't just oil pressure: why the measuring position matters
- The Volumetric-Hydrodynamic Feed-Pressure Index (VHFI)
- Why measurements before and after a conversion can't be compared
- We buy engines to take them apart: research at MMHP
- Oil-circuit simulator: work through the 2.0 TDI yourself
Transparency note: MMHP has been developing, testing and manufacturing its own products for the automotive industry for over 25 years, including solutions for the oil supply of VW TDI engines. The measurement technology described here is our internal development tool and is not available as a product; details on professional test-bench technology are documented in the source dossier.