¶ Measuring Oil Pressure: Why Your Gauge Lies to You
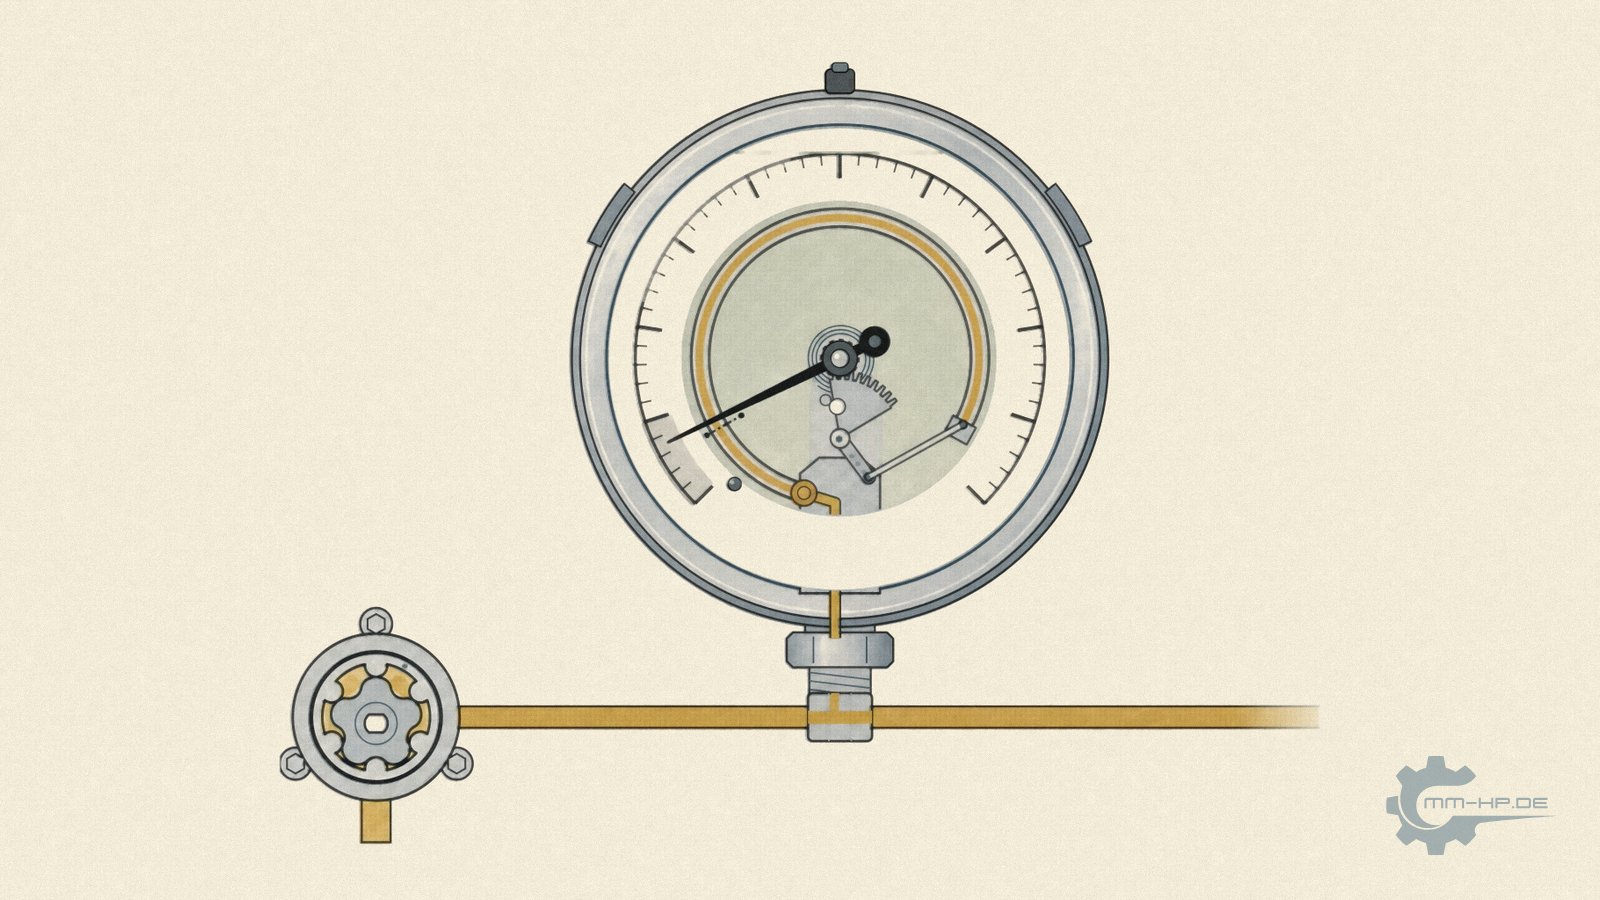
Schematic. The animation is further down in this article.
¶ The key points at a glance
Anyone who wants to check their engine's oil pressure buys an oil-pressure test kit for 30 to 80 euros, screws the gauge in where the oil-pressure switch normally sits, and reads off a value. It feels like a measurement. In reality it delivers a rough estimate, for reasons that sit inside the instrument itself.
The instrument is the first reason. Workshop gauges are built to accuracy classes that, per the relevant standard, are typically 1 to 2.5 percent of the span. On a 10-bar scale that is up to 0.25 bar, and that amount stays the same across the whole scale. At the top end it is a rounding error; at 0.7 bar on a hot idle it is more than a third of the value you just read. On top of that comes a sentence almost nobody knows: for gauges with a pointer stop, the accuracy class under DIN EN 837-1 only applies from ten percent of the scale range upwards. Below that, the standard guarantees nothing at all. And anyone measuring before and after a conversion should know that the two instrument errors do not cancel each other out, they can add up.
Then there is the glycerine fill, a deliberate damper that, by design, swallows fast pressure events. In everyday workshop use, calibration never happens. And even a perfect pointer instrument could only ever show what a pointer shows: a single value, at a single point, at a single moment, while oil pressure is in truth a curve across engine speed, load, temperature and time that looks different at every point in the engine.
The second reason is not the instrument but the moment. A hot idle is the least favourable point of the entire operating map, thin oil meeting the lowest pump speed there is. A low value at that point is physics first, and not yet a diagnosis.
For the question "is there any meaningful pressure at all?", the test kit is enough. For anything beyond that, comparisons, component assessments, or before-and-after statements, it is not, which is exactly why engine development and motorsport have worked for decades with electronic measurement chains in the kilohertz range instead of pointer gauges. We took the same path and developed our own measurement hardware and software.
That was the short answer. In the long version we take the gauge apart, literally: the standards and numbers behind it, the physics, what the professionals do differently, why a small figure at warm idle is part of the design, and what your own measurement can still be worth.
¶ Two gauges, two truths
Two test gauges, screwed onto the same engine one after the other. Same port on the cylinder head, same oil temperature, ten minutes apart. The first reads 0.7 bar. The second reads 0.9.
This experiment keeps coming up in support enquiries, and it is the best possible way into the subject. Because that difference is not a decimal place. It is an amount that would decide a diagnosis between "healthy" and "faulty", and it appears on an engine where nothing changed between the two readings.
The reflexive conclusion is that one of the gauges must be broken. The more honest conclusion is that both are probably fine, by the standards they were built to. The problem is the standards. To understand that, it helps to read what the standard actually guarantees for such instruments, and what it does not.
¶ What the dial actually tells you
Pointer-type pressure gauges are classified into accuracy classes under DIN EN 837-1; the US standard ASME B40.100 works in an analogous way. The class states the permissible deviation, and it is expressed relative to the span:
| Class | permissible deviation (of the span) | which on a 10-bar scale is | typical use |
|---|---|---|---|
| 0.1 / 0.25 | 0.1 / 0.25% | 0.01 / 0.025 bar | reference and precision gauges, laboratory |
| 0.6 | 0.6% | 0.06 bar | higher-grade industrial measuring points |
| 1.0 / 1.6 | 1.0 / 1.6% | 0.10 / 0.16 bar | standard industrial gauges, where most workshop oil-pressure testers sit |
| 2.5 | 2.5% | 0.25 bar | basic process monitoring |
| 4.0 | 4.0% | 0.40 bar | the most basic process indicators, the coarsest class the standard provides for at all |
Two things in this table deserve a moment's thought. The first is the reference quantity: percent of the SPAN, not of the reading. The span is the entire range the scale covers, so on an instrument running from zero to ten bar it is ten bar. A Class-1.6 gauge with that scale is therefore allowed to be off by 0.16 bar at any point, a Class-2.5 unit by 0.25 bar, no matter whether the pointer sits high or low. At the warm idle of a TDI, the diagnosis turns on values between 0.4 and 2 bar. For the Class-2.5 gauge that means an error budget of 12.5 percent of the reading at the upper end of that window and over 60 percent at the lower end, all entirely within spec. Two flawless gauges are allowed to disagree by half a bar, with nobody having done anything wrong.
The second point is less obvious and matters more: this class describes behaviour under STATIC pressure. It says precisely nothing about behaviour under fast pressure changes. But in the oil circuit of a running engine there is no static pressure; it pulses, fluctuates and jumps constantly. Before we get there, though, it is worth looking at what follows from that reference quantity once the pointer moves to the left.
¶ The error stays the same, its share grows
The reference quantity has a consequence you only see once you work it out. The error in bar is constant across the whole scale. Its share of the value you read is not. The table shows the same instrument, a Class-2.5 gauge with a 10-bar scale, at five operating points.
| Reading | absolute tolerance | share of the reading |
|---|---|---|
| 5.0 bar | ± 0.25 bar | 5% |
| 2.0 bar | ± 0.25 bar | 12.5% |
| 1.0 bar | ± 0.25 bar | 25% |
| 0.7 bar | ± 0.25 bar | 36% |
| 0.4 bar | ± 0.25 bar | 62.5% |
The middle column is the actual finding. It never changes. The instrument does not get worse towards the bottom of the scale, it stays exactly as good as it is at the top. It is just that down there you are measuring something very small with a yardstick built for something very large.
The 0.7-bar row is everyday reality at hot idle. Anyone reading 0.7 there has a fully compliant instrument in front of them whose true value is allowed to sit anywhere between 0.45 and 0.95 bar. One row further down, the tolerance grows larger than half the reading. The pointer still sits calmly and convincingly in its place, and that is precisely what makes it treacherous.
That already half-answers the opening question. Anyone comparing two measurements in this range, where the expected difference is itself only a few tenths of a bar, is trying to prove a change that is smaller than the error of the instrument.
¶ Where the guarantee ends
Up to this point the answer has been imprecise. From here on it is not guaranteed, and that is something else entirely.
In clause 6, DIN EN 837-1 does not only set out how large the permissible deviation is. The standard also says which part of the scale that promise covers at all, and it distinguishes two designs for that purpose. On gauges with a pointer stop, meaning a pin the pointer rests against when there is no pressure, the accuracy class only applies from ten percent of the scale range upwards. On gauges with a free zero, whose pointer can also travel below zero, it applies across the full scale, and zero additionally serves as a check point there.
That difference decides everything. On a 10-bar scale, the guaranteed range of a gauge with a pointer stop only begins at 1 bar. Anyone reading 0.6 or 0.7 bar at hot idle is then measuring below the range for which the instrument is given any accuracy at all. That is not a defect, and it is not user error either. It simply lies outside what the standard asks of the instrument.
Which of the two designs you have takes ten seconds to work out, on the depressurised instrument: if the pointer sits hard against a stop and cannot be pushed slightly below it, that is a pointer stop. If it floats freely and is allowed to point marginally into the negative, that is a free zero. In our experience, the datasheets of workshop test kits say nothing about this, and no more about the accuracy class itself.

Schematic. Left, pointer stop: the class applies only from 10 per cent of the scale. Right, free zero: the class applies across the whole scale.
Rule of thumb: below ten percent of the scale, the standard makes no promise. A number still appears there, but nobody stands behind it any more.
This is the hardest argument in this entire article, because it is not a matter of degree. Every other point says imprecise, and can at least be softened somewhat with care. This one says not specified, and no amount of careful work helps against that.
The graphic above has three sliders: pressure, accuracy class and engine speed. Drag the pressure slider from the middle towards the left and watch the two figures below the dial. The tolerance band keeps its width, the percentage runs away. The effect is easier to follow on a larger screen than on a phone. If the graphic does not appear for you, every value it shows is also in the tables in this chapter.
¶ A measuring range that doesn't match the job
So far this has been about how accurate an instrument is. There is a second question alongside it, and in practice it is more often the decisive one: whether the instrument is the right one for this measuring job at all.
There is a separate standard for that. While DIN EN 837-1 describes the instrument itself, the application standard DIN EN 837-2 governs its selection and installation. It is the source of the requirement that the maximum pressure load should not exceed 75 percent of the full-scale value under steady load, or 65 percent under fluctuating load. And manufacturers consistently add a selection rule you will find in almost every operating manual: the operating pressure should normally sit in the middle third of the scale range.
Let's work that through for our case. On a scale from zero to ten bar, the middle third is the range between roughly 3.3 and 6.6 bar. The oil pressure of a hot TDI at idle sits at around seven percent of the scale. Not at the edge of the recommended window, but an order of magnitude below it.
That shifts the assessment. A 0-to-10-bar instrument is built for systems that work at several bar, for hydraulics and compressed air. For the warm idle of a diesel engine it is not merely imprecise, it is structurally the wrong size.
Something practical follows from that, so we'll say it plainly: a gauge with a smaller measuring range, say zero to four bar or zero to 2.5 bar, brings the reading into a far more favourable third of the scale. The absolute tolerance drops with the span, and the guaranteed range begins correspondingly earlier.
¶ The measuring range beats the accuracy class
Just how strong that lever is only becomes clear when you put both side by side. The table below converts the classes from DIN EN 837-1 to the three measuring ranges that occur in automotive use. The arithmetic is simple: class times span.
| Class | 0 to 4 bar | 0 to 6 bar | 0 to 10 bar |
|---|---|---|---|
| 0.6 | ± 24 mbar | ± 36 mbar | ± 60 mbar |
| 1.0 | ± 40 mbar | ± 60 mbar | ± 100 mbar |
| 1.6 | ± 64 mbar | ± 96 mbar | ± 160 mbar |
| 2.5 | ± 100 mbar | ± 150 mbar | ± 250 mbar |
| 4.0 | ± 160 mbar | ± 240 mbar | ± 400 mbar |
Find the Class-1.6 row and the Class-2.5 row. A Class-1.6 instrument with a 10-bar scale sits at ± 160 mbar. A Class-2.5 instrument with a 4-bar scale sits at ± 100 mbar. The instrument with the worse-sounding class is the more accurate one, because its measuring range fits the job.

Schematic. The same value on two scales: the gauge with the worse-sounding class has the smaller error limit.
That is the practically most important figure in this entire article. Anyone buying an instrument looks at the class, if they look at anything at all. What actually decides it is how much scale they are buying that they will never use. Every bar of measuring range above what the engine will ever reach is bought with tolerance in exactly the region you actually want to read.
There is a second lever of the same kind, and it is even less conspicuous. The standard ties the nominal size, meaning the dial diameter, to the accuracy classes available. That is not a theoretical detail, you can read it in manufacturers' datasheets: in one widely used series of glycerine-filled Bourdon gauges, the same model carries Class 1.6 in nominal size 63 and Class 1.0 in nominal size 100. Same instrument, same design, one class of difference from the case diameter alone. Nowhere is that advertised as a drawback.
But even the best measuring range doesn't solve the remaining points. The damping stays, the missing calibration stays, and a pointer remains a pointer.
¶ What the datasheet says, and what it doesn't
That leaves the question of how you find out an instrument's class at all. On industrial gauges it is in the datasheet, together with nominal size, measuring range and the reference to EN 837-1. So you can work out what you are getting before you buy.
On test kits from the accessories trade it is different, in our experience. There you find the measuring range, the list of adapters and the case dimensions; the accuracy class often not. Without it the tolerance cannot be quantified, and the table above cannot be applied.
Anyone expecting independent testing bodies to fill that gap will be disappointed. In our research in August 2026 we found no independent comparative test of oil-pressure gauges with published readings, neither from the well-known consumer organisations nor from a test laboratory. For the related group of tyre-pressure gauges there is at least a laboratory test by a trade magazine, carried out at a pneumatics specialist on calibrated instruments, with fourteen devices at three test pressures. What was published from it, however, was not a systematic set of readings but largely verdicts. For one single device a deviation of at least 0.1 bar is mentioned.
If you know of such a study, do write to us. We will add it here.
That is where things stand: for the category of instrument with which many drivers make a technical decision about their engine, there is neither a mandatory verification nor an independent comparative measurement with published figures. There is the standard, and there is whatever a manufacturer chooses to write into the datasheet.
¶ Two measurements, two errors
Everything said so far applied to a single measurement. The most common case in practice is a different one, namely the comparison of two measurements before and after an intervention. And something happens there that many people intuitively get wrong.
The widespread assumption is that with two measurements on the same instrument the instrument error cancels out, because it is the same error both times. That only holds if it really is the same both times, and that is exactly what the standard nowhere guarantees. The class rating permits any deviation within its limit at every point of the scale, in both directions. If the instrument reads at the upper edge of its tolerance on the first measurement and at the lower edge on the second, that alone produces an apparent deterioration without anything on the engine having changed. The reverse case is just as possible and would fake an improvement that never existed.
In numbers, again on the Class-2.5 instrument with a 10-bar scale: the tolerance is 0.25 bar per measurement. In the worst case the two measurements therefore sit 0.5 bar apart, purely because of the instrument.
This is made worse by an effect the standard expressly permits. Under DIN EN 837-1, clause 9.2, the hysteresis error may be as large again as the permissible error itself. Hysteresis means that a pointer mechanism shows different values when it approaches a pressure from below than when it approaches it from above. The standard works this through with an example that happens to be exactly our case, an instrument with a 10-bar scale in Class 1: between rising and falling pressure, a difference of 0.1 bar is allowed. In a before-and-after comparison you practically never approach the operating point the same way twice, once while warming up, once while cooling down, once from cold, once after a drive.
That makes this the single most important chapter for anyone measuring after a conversion. Alongside the instrument error there is a second, entirely different reason why two such measurements cannot be set against each other, and that one lies in the engine itself. We have taken it apart in a separate article on the comparability of measurements.
¶ The glycerine fill: built-in forgetting
Many oil-pressure gauges are glycerine-filled, and for good reason: pressure pulses with every pump revolution, the line vibrates, and an undamped pointer would shake so much that nothing could be read. The viscous fluid acts as a shock absorber for the pointer mechanism and delivers a calm, readable picture.
You just need to understand what that comfort costs. Physically, the damping is a low-pass filter: anything that happens quickly is averaged out before it reaches the pointer. A pressure dip lasting a few milliseconds, of the kind produced by early drive-component wear, a hesitant valve, or a load change, simply does not exist for this instrument. It shows the smoothed average, and that average often looks flawless while something in the system is already going wrong. Winter makes this worse still, because cold glycerine becomes more viscous, making the instrument react even more sluggishly; the same measurement behaves differently in January than in July, without anything about the engine having changed.

Schematic, not to scale, the time trace heavily slowed down. Every tooth engagement of the pump adds a small ripple to the pressure, the faster the higher the engine speed. The movement sits in glycerine and follows only the average. The short dip (red triangle) is clearly visible in the pressure, the pointer shows almost nothing of it. At warm idle the pointer sits in the grey range below 1 bar.
Important for context: this is not a design flaw. A gauge on a hydraulic system is SUPPOSED to do exactly that, calmly display an average operating value. For diagnosing fast events in a combustion engine, it is simply the wrong tool for the job, in the same way that a bathroom scale is the wrong tool for weighing a falling object.
Rule of thumb: glycerine damping is not a measurement error, it is deliberate forgetting. Whatever happens faster than the pointer never happened.
¶ The errors that never appear on any dial
Accuracy class and damping are only the two most visible items. A mechanical pointer gauge brings along a whole family of further error sources, and what's really remarkable is not their size but their invisibility: none of them is disclosed on workshop instruments.
| Error source | What's behind it | What the user learns about it |
|---|---|---|
| Hysteresis | pointer mechanism shows different values on rising pressure than on falling pressure | nothing, even though the standard allows a further full permissible-error amount for it |
| Temperature effect | reading drifts when the instrument and medium deviate from the reference temperature | nothing, only the permissible operating range appears in the catalogue |
| Position effect | precision pointer mechanisms are calibrated for a defined mounting position | nothing, hardly any test-kit user has even heard the term |
| Zero-point drift | material fatigue of the Bourdon tube over years and load cycles | nothing, it stays invisible without a re-check |
| Parallax | reading at an angle shifts the apparent pointer position by scale divisions | nothing, the standard only requires countermeasures from Class 0.6 upwards |
| Nominal size | the dial diameter decides how much pointer travel a tenth of a bar gets | the size is in the catalogue, what it means for readability is nowhere |
| Air in the measuring line | trapped residual air acts as an additional spring and damps the reading a second time | nothing, it is invisible and appears in no measurement record |
The table reads almost the same seven times in the right-hand column, and that is exactly the point. For a sense of how seriously professionals take these items: for electronic industrial pressure transmitters, the temperature effect on the zero point alone is specified as its own parameter, typically on the order of 0.05 percent of full-scale value per 10 kelvin, on top of the base accuracy. A gauge that is screwed onto a cold engine in winter and read once it's hot passes through several such 10-kelvin steps in between. How much may accumulate there is actually written into the standard: in clause 9.3, DIN EN 837-1 permits a temperature-induced deviation of 0.04 percent of the span per degree of departure from the reference temperature, so 0.4 percent per 10 kelvin. An instrument with a 10-bar scale read in a 60-degree engine bay instead of at 20 degrees may be off by a further 0.16 bar on that account alone, eight times as much as the industrial sensor. The difference is only that for the industrial sensor the actual figure for that specific unit is in the datasheet and can be corrected for. For the workshop gauge you know nothing but the upper limit the standard allows, and what you don't know, you can't correct. The difference between professional and amateur measurement technology, then, is less that one is error-free, and more that it knows, quantifies and documents its errors, while the other simply stays silent about them.
Two items from the table deserve a paragraph of their own, because both have to do with how the measurement is set up and are therefore in your own hands. The first is nominal size. The standardised sizes are 40, 50, 63, 80, 100, 150, 160 and 250 millimetres, and that diameter determines how much pointer travel a scale division gets. On a small dial with a 10-bar scale, a tenth of a bar is a fraction of a millimetre. You cannot read more finely there, however calmly the pointer sits. The standard itself draws a conclusion from this that surprises many people: it ties nominal size to accuracy class. An instrument of 40 or 50 millimetres diameter is only provided for in Classes 1.6 to 4; at 63 and 80 millimetres Class 1 is added; and the finest Class 0.1 exists only in nominal size 250. That reference instruments are so large and carry a knife-edge pointer or a mirror scale is therefore not showing off. It is the only design in which the fine classes are achievable at all, and the standard consequently only requires parallax countermeasures from Class 0.6 upwards.
The second item is air in the measuring line, and it mainly affects the most elaborate variant of the garage measurement. Anyone wanting to read along while driving routes the hose into the cabin, often more than a metre. If air remains in it, it acts as an additional spring element, because air can be compressed and oil practically cannot. The line therefore damps a second time, on top of the glycerine fill from the previous chapter. Fully bleeding a 1.3-metre line is practically impossible under workshop conditions. In a hose with an inner diameter of only a few millimetres, an air bubble in oil does not rise on its own, surface tension holds it in place, and in the gauge's Bourdon tube, a thin, closed tube, trapped air stays put anyway. There is no reliable remedy. It is simply worth knowing that part of the damping you see at the pointer may come from this air.
¶ The word that's missing from the test kit
In professional measurement practice, a pressure gauge is only as good as its calibration certificate. Calibration there is carried out with both rising AND falling pressure, because pointer mechanisms have hysteresis, showing different values on the way up than on the way down, and that too has to be documented. The instruments are traceable to reference standards, and they are re-checked at fixed intervals, because springs settle, pointer mechanisms wear, and impacts leave traces.
And the workshop test kit? It gets bought, used, dropped, used again, for years. Whether it still shows what it should after the third fall off the workbench, nobody checks; there is neither an interval nor a reference. Two unchecked instruments that disagree therefore don't give you two opinions, they give you none, because you don't even know which one is closer to the truth. Which, incidentally, fully resolves the puzzle from the start of this piece: class tolerance plus hysteresis plus missing calibration together produce exactly the picture observed, two "correct" instruments, two values.
Because the terminology around testing is notoriously mixed up, here is the clean breakdown, three words, three completely different processes. Calibrating means: the instrument is compared against a reference standard and its deviation is documented; nothing on the instrument itself is changed. Adjusting means: a mechanical intervention is made and the reading is trimmed to minimise deviation. Verification (in the legal metrology sense) is a legally regulated process for measuring instruments used in the public interest, fuel pumps or trade scales, for example, and has nothing to do with oil-pressure measurement, even though the term keeps getting used for it in forums. The gold standard in industry is documented calibration by an accredited laboratory: the accompanying calibration certificate states the measurement deviations of that specific unit, complete with a full uncertainty budget and an unbroken traceability chain through the lab's own standards up to national standards such as those of the PTB. Such instruments run on fixed test cycles in industrial practice, typically twelve to thirty-six months. None of this, really none of it, exists for the test kit from the accessories shelf, and that is the structural difference: its pointer shows a number, but nobody on earth can say how far that number is from the true pressure.
¶ What a pointer fundamentally cannot do
Let's assume, for argument's sake, that the perfect gauge existed: freshly calibrated, Class 0.1, undamped and yet still readable. Even then, the structural problem would remain, and it doesn't sit in the instrument, it sits in the concept.
A pointer delivers exactly three limitations at once: ONE value, at ONE point in the oil circuit, at ONE moment, read by a human being. But an engine's oil pressure is not a number. It is a curve across engine speed, load, oil temperature and time, and it is different at every station of the circuit; conditions right behind the pump differ from those in the main oil gallery, which differ again from those at the end of the bearing gallery (we've described why in detail here). A single pointer reading relates to that process the way a single photo relates to an entire film, and a photo taken from a single seat in the audience, at that. It can prove that the cinema exists. It tells you nothing about the plot.
This, incidentally, is also exactly where the popular practice of comparing numbers against forum values and workshop anecdotes falls apart, but that's a chapter of its own, and it is also the deeper reason why we quote percentages rather than promising bar figures for our products.
¶ The pulsation nobody sees
One last point before we turn to how the professionals do it, and it turns the sluggish reading into a concrete physical problem. An engine's oil pressure isn't just "in motion", it has a built-in rhythm. The oil pump is a positive-displacement pump; it doesn't deliver continuously but tooth gap by tooth gap, and every tooth engagement imprints a small periodic ripple on the pressure. You can even calculate the frequency of that modulation: it's the product of pump speed and number of teeth. A worked example to give a sense of scale: a pump with ten teeth running at 1,500 rpm produces its pressure ripple at 250 hertz, in other words 250 times per second. That is exactly the calculation behind the engine-speed slider in the graphic above, whose lower half shows the process in slow motion. How the movement in its glycerine fill keeps only the average of it is shown in the cutaway in the chapter on the glycerine fill.
Just how far this sits beyond what a pointer is built for is something the manufacturers say themselves, if only in passing, in a subordinate clause of the operating manual. Above a pressure change of more than ten percent of full-scale value per second, reading the values is described there as impaired. On the 10-bar scale that limit is reached at one bar per second. The tooth engagement of an oil pump lies orders of magnitude above it.
Now let's put the pieces of this article together. A glycerine-damped pointer instrument is, as described above, a low-pass filter; its world ends well below such frequencies. Of the pulsating process, it shows the smoothed average, and that's all it can, or should, do. But anyone trying to capture faster events with measurement technology that's too slow runs into a problem signal theory calls aliasing: if a signal is sampled less often than its highest frequency requires, the result contains phantom frequencies that have nothing to do with what actually happened. The textbook example: a 1,600-hertz signal, sampled at 2,000 hertz, appears in the data as a clean 400-hertz signal that never existed. Professional measurement chains therefore place an anti-aliasing filter ahead of digitisation and sample with margin to spare. The lesson for garage measurement is sobering and reassuring at once: "slow measurement technology" isn't just a matter of missed detail. Measuring too slowly can show you things that were never there, and the only safeguard against that is a measurement chain built for the dynamics of the signal.

The textbook example as a picture: anyone who only knows the red points sees a 400 hertz wave that never existed.
¶ When low pressure is exactly right
So far this has been about the instrument. Now it is about the engine, because part of the confusion does not come from measurement technology at all. It comes from an expectation.
Oil pressure is not a reserve an engine builds up. It is the resistance the pump has to overcome to push oil through galleries, bearing clearances and piston-cooling jets. From which something follows that runs against intuition: if the resistance falls, the pressure falls, even though the pump delivers exactly as much as before. Hot oil is thinner and flows more easily. It therefore produces less back-pressure, not because something is missing, but because it is doing its job. We've covered separately how strongly temperature intervenes here.
Idle supplies the second half. The oil pump hangs off the crankshaft, so at idle it turns more slowly than in any other operating state. The thinnest oil meets the lowest delivery speed. Anyone measuring at a hot idle is therefore measuring the least favourable point of the entire operating map.
That an engine copes with that point is something it demonstrates every winter. On a cold start the oil is viscous, the resistance correspondingly high, and even at idle pressures arise next to which the warm idle figure looks tiny. So that nothing is overloaded in the process, the pump carries a pressure relief valve that bleeds off the peaks. Every engine runs through that range on every cold morning, without anyone watching. The design is therefore not built around one narrow target value but around a wide range, and it regulates itself within it.
So what does the single figure actually tell you? Less than most people assume, and the engine itself demonstrates it. It carries a built-in verdict on its own oil pressure, the warning lamp, and that hangs off a simple pressure switch with a spring threshold. Two states, no resolution. How coarse that warning system really is, and why it responds so late, is a chapter of its own. For our purposes one thing matters above all: between "the lamp is off" and "everything is fine" lies a wide, unobserved space. Every warm-idle reading sits somewhere in that space.
Rule of thumb: a low value at hot idle is physics first and not yet a diagnosis. It describes the least favourable point of the operating map, read off with the least suitable tool.
It becomes meaningful where a single figure never can, namely in change. A value that slips away over months. A noise that wasn't there before. A lamp that flickers briefly. A pressure that collapses under load rather than at a standstill. Those are observations with a direction, and direction is something a single glance at a pointer cannot deliver by design. Anyone left uncertain after a conversion will find the right order for troubleshooting in a separate article.
¶ How the professionals measure
It's worth looking at where oil pressure is measured professionally, in engine development and motorsport, because there the pointer instrument has been history for decades.
Measurement there is electronic: piezoresistive pressure sensors capture pressure from static all the way up into the range around 50 kilohertz, meaning they also see events lasting mere fractions of a millisecond. On development test benches, such sensors feed into measurement chains with, in some cases, more than a thousand channels; dynamic quantities are recorded at sampling rates of up to 50,000 readings per second. In motorsport, oil pressure and oil temperature are standard channels on every data logger, monitored not by glancing at a gauge but as a recorded trace analysed after the run.
The decisive difference here isn't simply "a better sensor". It's the CHAIN: a fast pickup, electrical transmission, digital sampling, and, most importantly, synchronous recording alongside the rest of the engine data on a shared time axis. Only once pressure, engine speed and oil temperature sit side by side on the same millisecond grid can you separate cause from effect: whether a pressure drop came from a load change, from hot oil, or from a component wearing out. A pointer can't even ask that question.
Our own measurement technology works on exactly this principle, as described here, with one addition that even many test benches lack: we measure at several positions in the oil circuit SIMULTANEOUSLY, because our core question is the supply chain as a whole. Our internal comparison metric, the Volumetric-Hydrodynamic Feed-Pressure Index (VHFI), is also derived from these measurement series. We explain in the linked article why no such system existed to buy and why we had to build it ourselves.
Which positions we tap into, and what ends up feeding that metric, we keep to ourselves. That selection grew over years and over many dismantled engines, and it is a good part of what separates our work from simply taking a reading. The result sits in every system we ship.
In fairness, the yardstick we held against the test kit above belongs against us as well. The gold standard of an accredited laboratory with unbroken traceability up to national standards is the calibration industry's own benchmark, and outside calibration laboratories hardly anyone meets it in full, ourselves included. What carries our statements is therefore a different principle: we always measure with the same chain, at the same positions, under logged conditions, and we compare engines and states against each other rather than against an absolute target value. A chain whose systematic deviation is the same in every measurement cancels out in the comparison. That is exactly why the VHFI is a comparison metric and not an official pressure figure, and exactly why we quote percentages rather than bar figures for our products.
¶ What your garage measurement is still worth
After so much deconstruction, the fair counter-question: does that make the test kit useless? No, you just need to know which questions it can answer.
What it's good for: yes/no questions with a wide margin. Is there any meaningful pressure at all, or has the supply collapsed? Does the engine build up pressure again at all after a repair? Such coarse diagnoses are legitimate, that's what these kits were built for, and that's what we recommend them for too. That the accuracy class is no longer guaranteed at the very bottom of the scale doesn't get in the way of that kind of question, because the gap between "somewhat under one bar" and "next to nothing" is many times larger than any tolerance we discussed above. Anyone who buys an instrument with a smaller measuring range pushes that detection threshold further down still and gets a noticeably more useful coarse diagnosis for the same money.
What it's not good for: anything requiring precision or comparability. Before-and-after comparisons across a conversion, assessments of individual components, comparisons with values from forums or other vehicles, statements like "0.3 bar too low". In this territory the instrument produces numbers that look more precise than they are, and false precision is more dangerous than honest uncertainty.
¶ What turns a number into a finding
If you send us measurement values, we'll take a look. We then need the full picture, though, otherwise we are building diagnoses on sand. The list below is not bureaucracy. Every line rules out one specific error source from this article.
| Information | Which uncertainty it removes |
|---|---|
| Measuring point, as precisely as possible | the pressure is different at every station of the circuit |
| Oil temperature as a figure, not "warmed up" | viscosity sets the resistance and therefore the pressure |
| Engine speed | idle is the least favourable point of the map, other speeds say more |
| Instrument with measuring range, and accuracy class if stated | only then can the tolerance be quantified at all |
| Oil type and the age of the fill | diluted or aged oil shifts the value system-wide |
| The engine's history, mileage, most recent work | separates a conversion effect from an overhaul effect |
| Several readings instead of one | a single value has no scatter, and without scatter there is no confidence |
The second-to-last line is the one most often missing and the one that explains the most. An engine with 290,000 kilometres and a fresh overhaul is a different case from the same engine untouched, even if both display the same figure.
The last line costs nothing and has the strongest effect. Anyone who reads off three times in a row instead of once sees immediately how steady or unsteady their own instrument is. If the three values differ noticeably, you have just reproduced this entire article on your own test kit in two minutes.
A value without this information isn't a measurement, it's just a number.
¶ See also
- Oil pressure is not just oil pressure: why the measuring position matters
- Why measurements taken before and after a conversion cannot be compared
- How we measure oil pressure: our own hardware, our own software
- Why we don't promise bar figures
Transparency note: MMHP has been developing, testing and manufacturing its own products for the automotive industry for over 25 years, including solutions for the oil supply of VW TDI engines. The standards and measurement-technology figures in this article are backed by sources in our dossier; the assessments of workshop practice are based on our own measurement and support experience.