¶ Research at MMHP: Buying, Dissecting, Measuring Engines
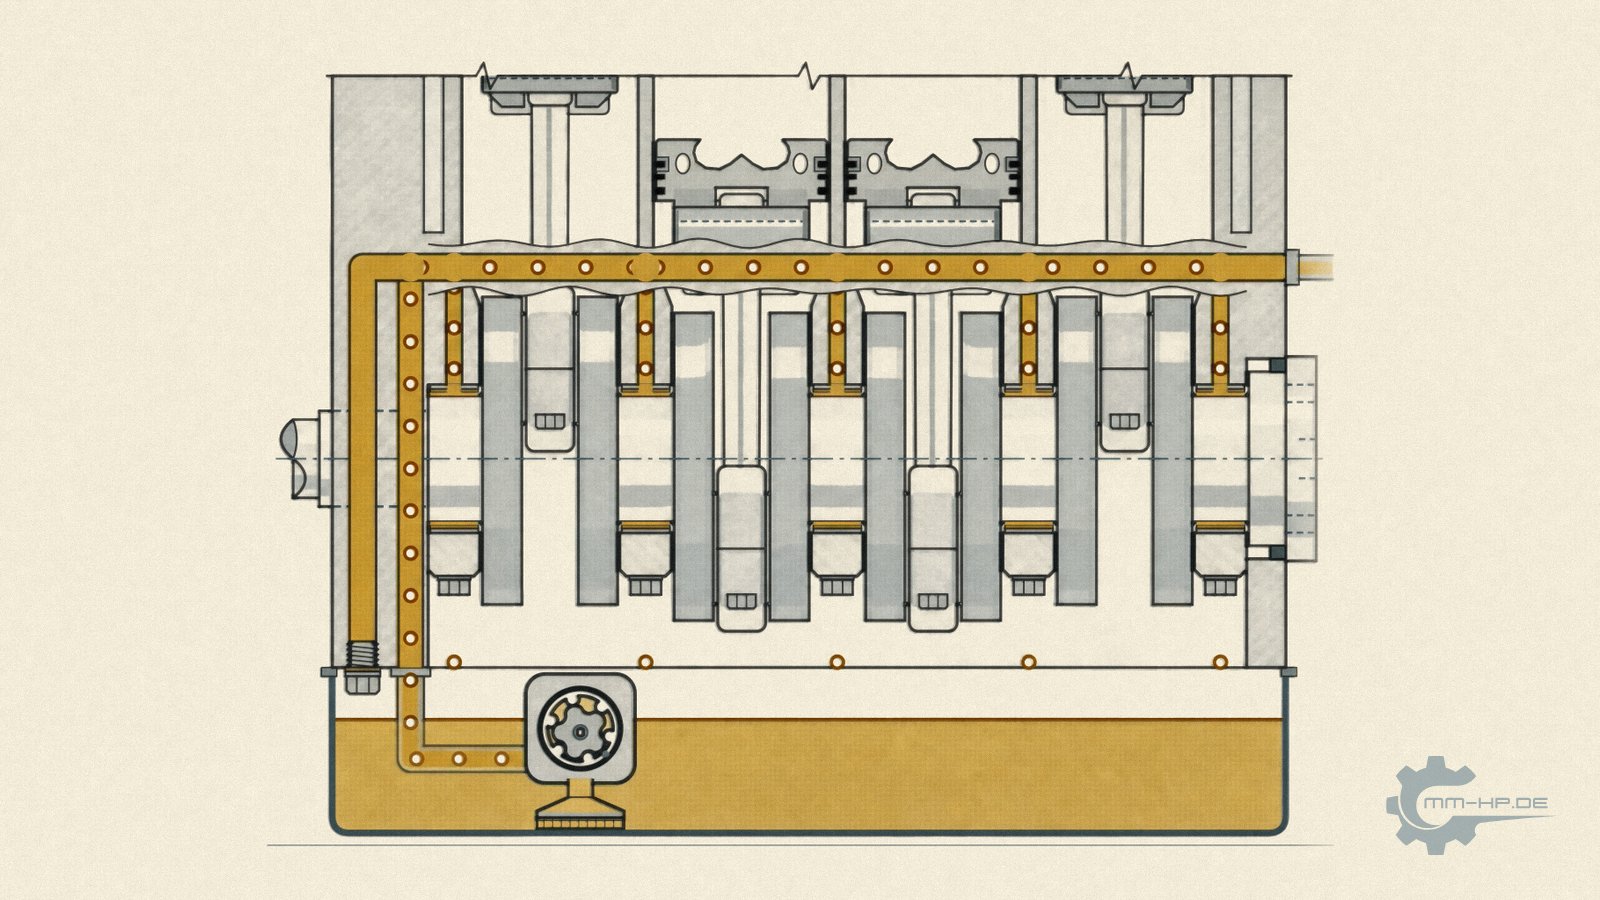
Longitudinal section through the crankcase, schematic: this is how an engine looks when we set out to understand it.
¶ The key points at a glance
There are two ways to develop an aftermarket product. The fast one: take the original part, copy it, reinforce it at an obvious spot, print a catalogue. And the other one: understand the system the part works in first, then develop. The second path regularly begins for us with a purchase contract, because we buy vehicles and engines for the sole purpose of taking them apart.
What follows is a programme that's the exception in the aftermarket: complete teardown with documentation of wear patterns, systematic measurement not just of nominal dimensions but of real manufacturing tolerances and surfaces, right down into oil galleries and bearing bores, geometry capture via 3D scan for CAD reconstruction, measurement runs on running engines with our own multi-position measurement technology, and finally practical testing in real test vehicles, including our own T5 with a CFCA engine as a permanent development platform. The lab is complemented by the field: for questions only everyday use can answer, we fit customer vehicles with measurement systems — that's how our figure for oil-temperature reduction came about, for instance — and we systematically collect case patterns from support, more than one of which has become a new research topic.
This effort is expensive and slow, and it's the reason our range is narrow. But it's the only way of working that fits products on which the survival of other people's engines depends: with a trim part, you're allowed to guess. With an oil pump, you're not.
The long version takes you through the complete programme once, from the shopping list to the workbench to the test vehicle, and uses concrete examples to show how products, insights, and this knowledge section itself ultimately emerge from disassembled engines.
¶ Two ways to build an aftermarket part
You can't tell the two development paths apart from the finished product right away, and that's exactly the problem. A copied drive dog and a fully engineered one look identical in the product photo. A conversion kit from the fast-track process and one from five years of systems work barely differ in the box. The difference only shows up in operation, after 50,000 kilometres, with hot oil, in the edge case — in other words, exactly when returning it is no longer an option.
That's why, in this article, we explain in detail HOW our products come into being. Not as factory-tour folklore, but because the method is the real quality promise: anyone who knows how a part was developed can judge what it will do in the edge case. And our method begins in a place you'd least expect from a parts manufacturer: buying a used vehicle.
¶ The shopping list: vehicles with a history
Vehicles regularly sit in our yard that we will neither sell nor restore. We bought them to examine them, and the most valuable ones among them aren't the well-kept ones — they're the ones with a history: high mileage, documented oil consumption, early symptoms. A healthy engine shows how the design was intended. An engine with an EARLY-STAGE failure shows something much rarer: the failure mechanism in slow motion — where it started, in what order the chain developed, what was cause and what was effect. A catastrophic total failure, by contrast, is almost worthless forensically, because the finale has destroyed the traces of the first act.
Some of these vehicles stay with us permanently, as rolling development platforms. The best-known example is our T5 with a CFCA engine, the most notorious unit in the EA189 family: measurement setups have been developed on it, conversion variants trialled, and operating conditions recreated that we would never put a customer's vehicle through. When we write in support that we keep this model ourselves for testing and development purposes, that's not a figure of speech — it's a statement of fact.
¶ Taking apart means understanding
An engine on the workbench, fully disassembled, answers questions that no datasheet and no spare-parts catalogue can answer. How are the oil galleries actually routed, with what cross-sections, transitions, and intersections? Where did series production visibly cut corners, and where, surprisingly, did it not? Which components show which wear patterns after 150,000 kilometres, and do these patterns match the theories circulating online, or do they disprove them?
That last point in particular has redirected our work more than once. The common explanation for this engine generation's oil consumption, for instance — "the rings pump the oil upward" — didn't hold up on the workbench: the wear and deposit patterns of disassembled engines told a different story, which we then traced through measurement until, eventually, the blow-by atomisation chain emerged — today one of the central findings of our knowledge section. Without the teardowns, we'd probably have simply repeated the forum explanation, like everyone else.
¶ Measuring what nobody else bothers to measure
After disassembly comes the part that hardly anyone in this industry takes on, because it's unspectacular, time-consuming, and expensive: systematic measurement. We don't just record whether dimensions fall within tolerance, but WHERE in that band they fall, and what the surfaces are actually like, right down to roughness measurements in oil galleries and bearing bores.
Why this effort deserves its own chapter, we've explained in detail in our unique-engine article: series-production engines vary due to manufacturing, and the oil supply reacts disproportionately sensitively to this variation. For development work, this leads to a hard rule: measure only one engine, and you know one engine. Only measuring MULTIPLE units reveals the range within which an aftermarket system has to work, and only that range tells you how much reserve a design needs so it doesn't just work in the one sample measured, but also in the worst-case engine that will ever order a kit. This range data, collected over years, is among the most valuable material in our files, and it's the reason our design philosophy so consistently targets the unfavourable end of the field.
¶ 3D scan and CAD: knowing exactly what's there
For geometry capture, we use 3D scanning technology; the scans produce CAD reconstructions of the original parts AND their installation situation — space envelope, mounting dimensions, clearance zones, cable and line routing. Reverse engineering, for us, explicitly does not mean copying — it means creating an exact digital truth to design AGAINST.
The difference becomes tangible with an example: anyone who simply copies a drive dog also copies its flaws. Anyone who has instead measured the real bushing geometries of multiple engines can design a component that factors in the MANUFACTURING VARIATION of the mating part, with deliberately chosen oversize where the original left too much play, and oil-film clearance where it's needed. This exact way of thinking is built into the version history of our reinforced drive dog and into every installation-position variant of the conversion kits.
¶ The tools: what modern measurement technology can see
So that "measuring" doesn't stay a black box, here's a brief overview of the class of tools this kind of work is done with today, and the orders of magnitude they operate in.
| Method | What it captures | typical accuracy class |
|---|---|---|
| structured-light 3D scan | complete external geometry as a point cloud | from approx. 0.01 mm |
| industrial computed tomography | INTERNAL structures: channels, cavities, porosity in castings | target-actual comparison against CAD, false-colour visualisation |
| coordinate measuring machine | individual dimensions, forms, positional tolerances | fractions of a micrometre plus a length-dependent component |
| stylus profilometry | surface roughness (Ra, Rz) with a diamond stylus | micrometre-scale profiles |
| roundness measurement | deviation from ideal circularity on journals and bores | down to the nanometre range at reference class |
Two lines deserve explanation. Computed tomography is the quiet star for our purposes, because it sees the one thing neither callipers nor an optical scanner can ever reach: the internal oil galleries in the cast block, their true cross-sections, transitions, and casting quality. The result is overlaid as a false-colour image against the CAD target; deviations light up in colour — an industry standard in casting inspection. And stylus-based roughness measurement delivers the Ra and Rz values whose significance for the flow resistance of galleries we derived in the unique-engine article. Anyone reading such figures in our knowledge section now knows what kind of measurement technology they come from.
¶ Crazy? The industry does exactly the same thing
There's an objection we occasionally hear: isn't it overkill for a mid-sized company to buy vehicles just to take them apart? The industry itself provides the answer, because this exact approach is an established business model there. The best-known example is A2Mac1: a company that has done nothing else since 1998 but buy series-production vehicles, fully disassemble them, scan them, and measure them — around 70 vehicles a year, over 1,100 documented teardowns in its database. Its customers are the vehicle manufacturers and their largest suppliers — precisely the companies that already own every design dataset in the world. They still pay to have competitors' products disassembled and measured, because they know: what a product really is doesn't show up in the datasheet — it shows up in the part.
Our programme is the same method, just focused: not 70 vehicles across the whole market, but the engine families we concentrate on — but to a depth that includes roughness measurement inside the oil gallery. We didn't invent this approach. We applied it to a niche where nobody else was paying for it.
¶ Measuring on the living object
The workbench shows geometry and history, but not dynamics. That's why the second building block is inseparable from the teardown programme: measurement runs on running engines with our own multi-position measurement technology, which records oil pressures along the supply chain simultaneously with rpm and temperatures, at millisecond resolution, under logged conditions. Only the combination of both — measured geometry plus measured behaviour — produces the complete picture of an oil system, and it's from exactly these data series that our internal comparison metric, the VHFI, is derived.
Added to this is a third data source we've systematised over the years: the field. For questions that can't be answered in the lab because they depend on real-world usage behaviour, we fit customer vehicles with measurement systems and evaluate the feedback as comparably as possible. That's how, for example, our figure for oil-temperature reduction after conversion came about — on average 10 to 15 degrees — a result no test bench in the world could have delivered, because it reflects the typical driving of real customers. And support is a research instrument too: recurring case patterns are pooled and evaluated at our end; the noticeable cluster of oil-pressure problems after engine rebuilds, for instance, is something we're currently observing exactly this way, as a systematic case collection from which, once it becomes robust enough, the next article in this knowledge section will emerge.
¶ Testing before the customer does
Between design and sale lies a phase that can't be shortened: practical testing in real test vehicles, over long distances and operating conditions that can't be fully recreated on any test bench — trailer towing, short-trip winters, sustained motorway load. What doesn't hold up there gets changed or discarded, and both have already happened.
What this principle looks like in production is shown by the publicly documented version history of our drive dog — four development stages, each built from the documented experience of the previous one. And what it looks like for new topics is shown by our current development project: on the way to our own oil-mist separator, we measured the available universal catch tanks (sobering results), built prototypes, and ran the stress test on a severely damaged test engine — oil consumption down from 6.7 to 0.8 litres per 1,000 kilometres. The full story, including an honest assessment, is in the blow-by article. A project only appears in the shop once it has completely run this gauntlet; before that, at most, as here, as a workshop report.
¶ What flows back into the product, and what flows back to you
In the end, this programme feeds three things. First, the products themselves: pump sizes, ratios, material choices, and installation-position variants of our kits are distillates of teardowns, measurements, and data series, not of catalogue comparisons, and the design targeting the unfavourable end of series variation is the direct reason why we almost always recommend Stage 2. Second, advice: when a customer describes a failure pattern, the person answering at our end has had that exact failure pattern disassembled on the workbench — that fundamentally changes the quality of a support answer. And third, this knowledge section: practically every article here, from the blow-by chain to manufacturing tolerances, is a by-product of this research work, written down because we believe that solid understanding is the best buying advice.
What we do NOT publish is the raw data behind it — the measurement series, range maps, and design rules accumulated over a decade. This material is the core of what this company can do, and therefore an asset we protect, as any manufacturer does with its know-how. We ask for your understanding, and hope this glimpse into the method still shows enough: namely why a narrow range from this workshop can carry more substance than a broad catalogue from the fast-track process, and why the range stays this narrow.
¶ See also
- Every engine is one of a kind: manufacturing tolerances and oil pressure
- How we measure oil pressure: our own hardware, our own software
- Oil consumption in the 2.0 TDI: the blow-by chain reaction
- Why we focus on a small number of engines
- The Volumetric Hydrodynamic Feed-Pressure Index (VHFI)
Transparency note: MMHP has developed and manufactured products for the automotive industry for 25 years. The research and measurement work described here is the basis of our own conversion solutions; the measurement results mentioned are put into context in the respective linked articles.