¶ Before/After Oil Pressure Readings: Why They Mislead
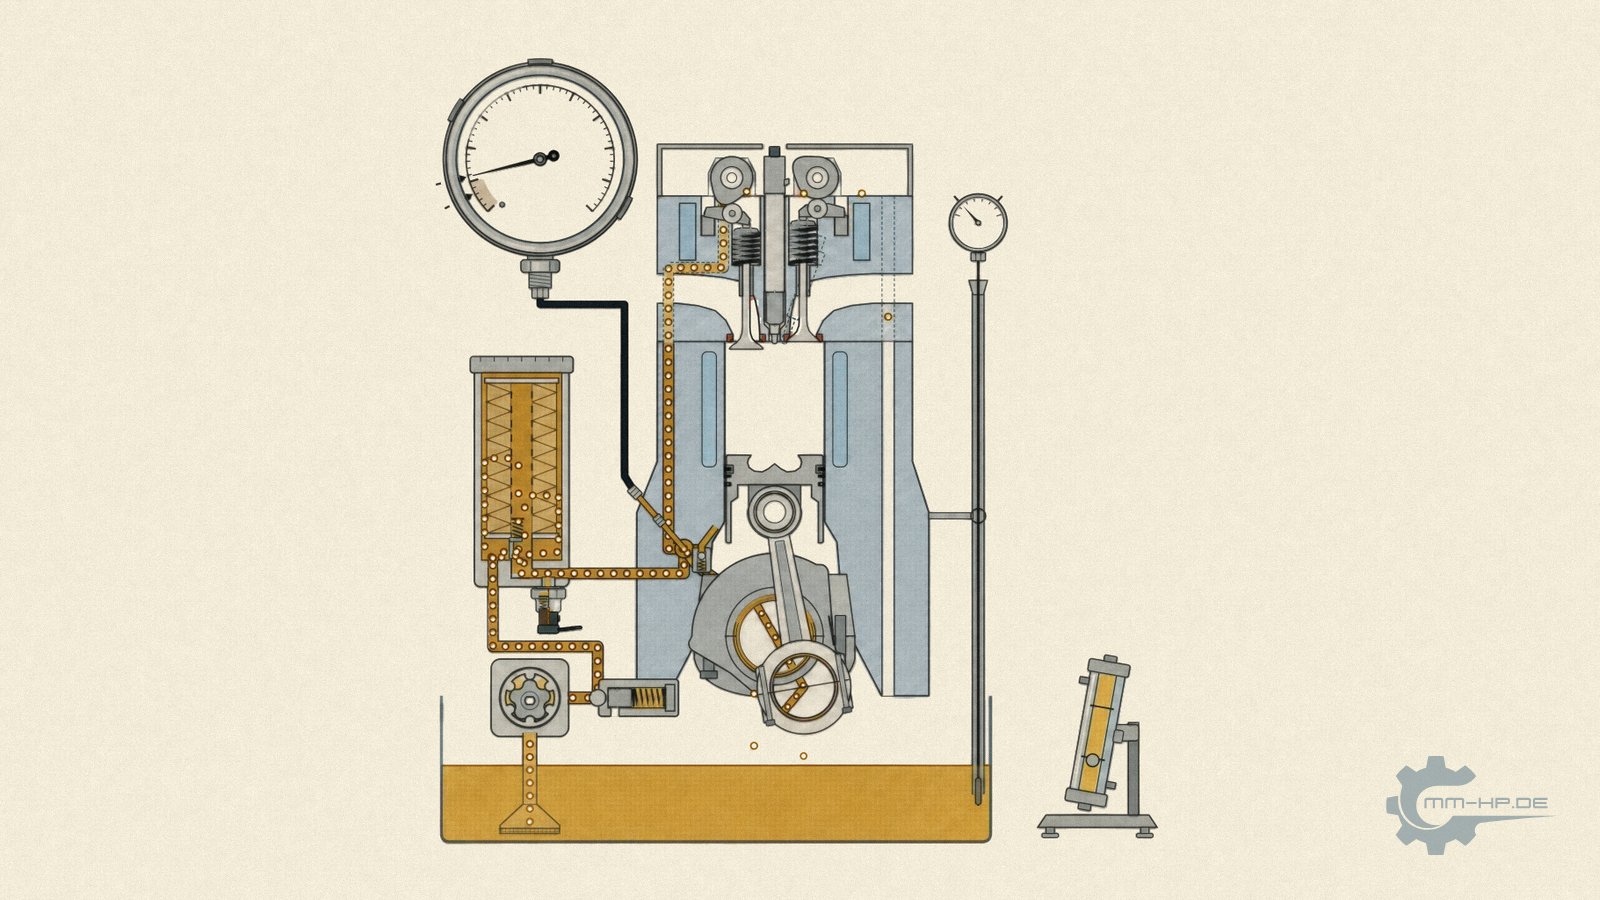
Schematic. The animation is further down in this article.
¶ The key points at a glance
It's the most understandable impulse in the world: measure oil pressure before the conversion, measure it again afterward, and the two figures show, in black and white, what the conversion achieved. We regularly receive such comparison measurements, and some customers keep meticulous measurement series over months. The intention deserves respect. The result still can't deliver what it promises, for measurement-technical reasons that hold regardless of how careful the person measuring is.
Metrology only permits strict comparisons under repeatability conditions: same system, same instrument, same boundary conditions. If exactly ONE condition changes, it's called reproducibility conditions, and even then you have to know and account for the deviation. But a before-and-after measurement on a converted engine changes EVERYTHING at once: the hydraulic system itself is different after the conversion (that's the whole point), the oil temperature never hits exactly the same value twice (and pressure depends directly on viscosity), weeks pass between the measurements with different oil and different condition, and measurements are taken with sluggish, uncalibrated instruments of unknown daily form. A difference between two such numbers can no longer be attributed to any single cause. It isn't wrong. It's meaningless.
Comparisons only become reliable with controlled boundary conditions: identical measuring positions, defined temperature windows, a known measurement system, complete curves instead of single readings. That's exactly how we run our own measurement series, and if you send us your own values, the single most helpful thing you can do for us (and yourself) is provide a complete measurement log — the required details are listed at the end of this article.
The long version examines all four sources of interference individually, shows real cases from our support where thorough measurement series still led nowhere, and explains why the engines themselves have the final word against comparability.
¶ The most understandable mistake in the world
Before we get into metrology, a word in defence of those who try this. Our support has seen cases where customers demonstrated impressive discipline over months: repeated measurement series at different engine speeds, documented oil temperatures, instruments swapped for cross-checking, even oil changes between series to rule out brand effects. That's more rigour than some workshops apply, and yet these series regularly ended up in the same state: contradictory numbers, growing uncertainty, no reliable conclusion.
That's not down to the people involved. It's because this measurement task is, in principle, unsolvable under field conditions, and that can be shown, not just claimed. It takes a short detour through three concepts that metrology has used for decades to sort out exactly these questions.
¶ What metrology says about it: three terms that clear everything up
| Term | Meaning | Condition |
|---|---|---|
| Repeatability | Spread when repeating the same measurement | ONE instrument, ONE system, ONE operator, in quick succession, constant conditions |
| Reproducibility | Spread when exactly ONE condition changes (e.g. the instrument) | All other conditions constant, deviation known and can be corrected for |
| Reference conditions | Agreed, constant boundary conditions (e.g. reference temperature) | Manufacturer accuracy claims apply ONLY under these conditions |
These terms sound bureaucratic, but they encode hard logic: a numerical comparison is only meaningful if you know WHAT changed between the two numbers. If one condition changes, you can attribute the difference to it. If several change at once, the difference is spread unresolvably across all of them — you don't even know whether the influences added up or cancelled each other out.
Now let's honestly count what changes simultaneously in a before-and-after measurement across a conversion. There are at least four fronts.
¶ Four things change at the same time
The four sources of interference below are not four opinions. They are four building sites, all of them open at once during a before-and-after measurement. Each one on its own would be manageable. Together they make the difference impossible to resolve.
¶ First: the system itself is a different one
During the conversion, the entire oil supply system is rebuilt: a different pump with a different characteristic, a different drive, the balancer shaft module removed, an altered pressure gradient across the entire supply chain. So you're not comparing the same engine in two states, you're comparing two different hydraulic systems that happen to live in the same block.
Here's the catch: that the two systems deliver different values isn't a finding, it's the PURPOSE of the conversion. The interesting question would be how and WHERE they differ, because the new pump completely changes the engine's internal pressure distribution — strongly at some points, barely at others (why every station has its own truth). A single measuring point, typically wherever the adapter happened to fit, doesn't answer this question, it randomises it. Depending on position, the same successful conversion can show more, the same, or in individual cases even less reading there, without anything being wrong.
¶ Second: temperature always plays along, and it plays dirty
Oil pressure, physically speaking, is flow resistance, and that depends directly on the oil's viscosity. Viscosity, in turn, depends drastically on temperature. The technical literature puts it bluntly: pressures measured too cold come out deceptively high. A few degrees' difference in oil temperature already shifts the reading noticeably; between "briefly warmed up after a cold start" and "after 100 kilometres of motorway," lie worlds apart. At the same engine speed, the pump pushes the same amount of oil through the same bearing gaps. If the oil is thinner, it meets less resistance in those gaps, and the gauge reads lower without anything having changed on the engine.
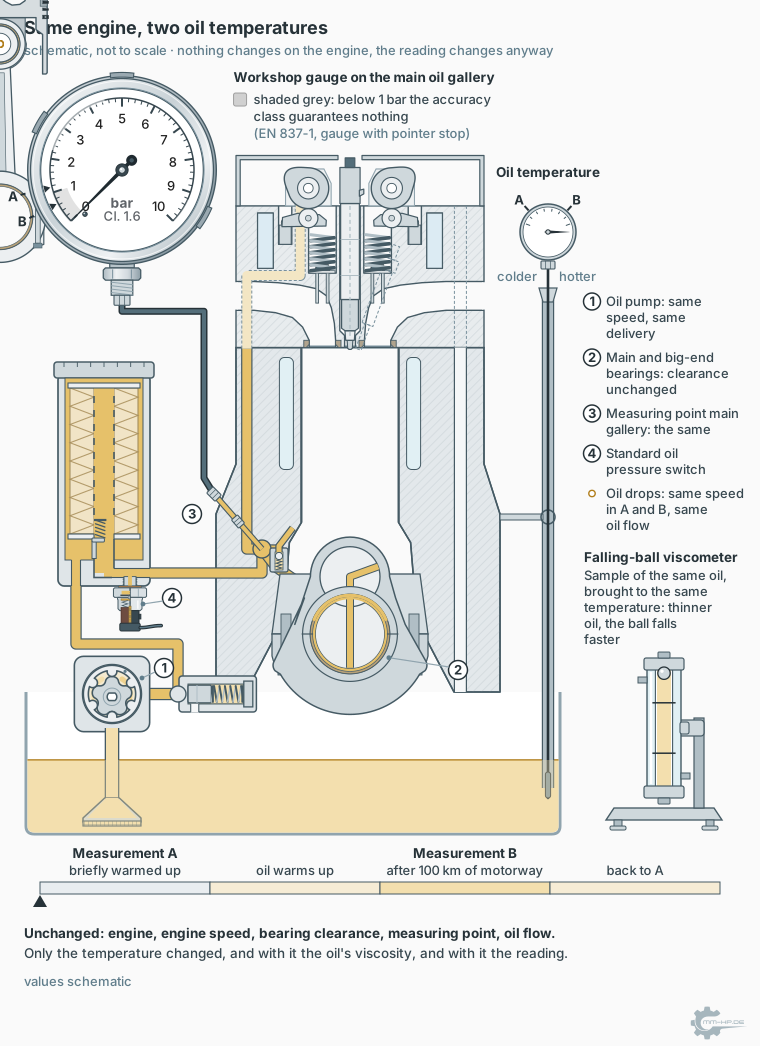
Same engine, same speed, same bearing clearance: only because the oil is warmer and therefore thinner, the gauge reads lower at measurement B than at measurement A. Values schematic.
For the before-and-after comparison, this means: without an exactly matching temperature level for both oil AND engine at both measurements, you're really comparing two temperature states, not two oil systems. And hitting that level exactly twice without a test-bench environment, weeks apart, in different seasons, is practically impossible. It gets even more subtle: even the oil brand carries a trap. The SAE grade on the container (say, 5W-30) isn't an exact physical description; two oils of the same grade may differ noticeably in their real viscosity behaviour. Anyone who switched oil brands between measurements has pulled in another variable without noticing.
¶ Third: the time in between
Days to weeks pass between removal and finished conversion, and time works busily on the boundary conditions: fresh oil instead of aged oil (or vice versa), different fuel entry into the oil, different ambient temperatures, and, often overlooked, the new system itself is still changing during its first operating hours — components run in, clearances settle (why running-in deserves its own chapter). The "after" measurement from the first week and the same measurement after 5,000 kilometres are, again, two different measurements.
¶ Fourth: the instrument
We've written a separate article about the tools used for these comparisons; here's just the essence. Workshop gauges are, per their own accuracy class, permitted to show deviations in the range of tenths of a bar, they're damped and therefore blind to fast events, they have hysteresis, and they were never calibrated. Their daily form is its own unknown variable, and the popular trick of "double-checking with a second gauge for safety" only adds another unknown variable to the experiment. We've seen cases where switching instruments mid-series produced more difference than the entire conversion.
One point from that deserves its own weight here, because it goes to the heart of this article. Many people assume the instrument error drops out of a before-and-after comparison by itself, since the same instrument measures twice. That would require it to be off in the same direction and by the same amount both times, and no standard guarantees that. The accuracy class permits any deviation within its limit at every point of the scale, upwards as well as downwards. On a Class-2.5 gauge with a 10-bar scale that is 0.25 bar per measurement. In the worst case the two values end up half a bar apart, and that difference comes entirely from the instrument. It can fake an improvement just as easily as a deterioration. On top of that comes hysteresis, for which DIN EN 837-1 permits the same amount again, and which strikes systematically here because you almost never approach the operating point the same way the second time. We work through how these amounts add up in the gauge article.
How large that share becomes in the range that matters for warm idle is best explored hands-on. The gauge article contains a calculator with three sliders for exactly that:
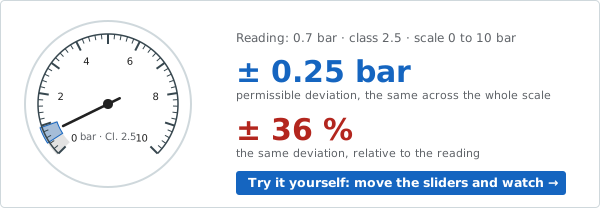
Still image. The sliders only move in the article itself.
➜ Open the tolerance calculator and try it yourself
Drag the pressure to the left there and watch the two figures: the deviation in bar stays the same, its share of the reading grows. That share is precisely what makes a before-and-after comparison worthless in the lower part of the scale.
¶ What that adds up to, with an example
Let's work through a typical case of the kind that reaches us regularly. Before the conversion the gauge showed 0.8 bar at hot idle, after the conversion 0.7 bar. The obvious conclusion: it got worse, the conversion achieved nothing or even did harm. Let's look at what that difference of 0.1 bar can consist of.
| Source of interference | What it can contribute | Quantified? |
|---|---|---|
| The instrument, Class 2.5 on a 10-bar scale | ± 0.25 bar per measurement, worst case a 0.5 bar spread between the two | Yes, from DIN EN 837-1 |
| Hysteresis of that same instrument | The full error limit once more on top | Yes, from DIN EN 837-1 |
| Oil temperature, a few degrees' difference | Shifts the value noticeably, direction unknown | No |
| Measuring position, different adapter or different system behind it | Can act in either direction | No |
| Time in between, oil condition, running-in | Acts, amount unknown | No |
The first row is the only one that can be quantified, and it settles the matter on its own: the half bar from the previous section is five times the observed difference. Those 0.1 bar therefore lie entirely within what the same instrument would have delivered even if nothing at all had happened to the engine. On top of that, both readings are below 1 bar. For a gauge with a pointer stop the standard guarantees no accuracy at all there, and that is exactly where a healthy engine sits at hot idle.
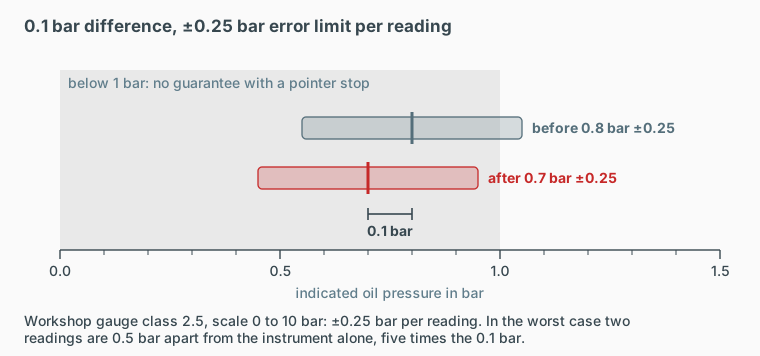
Schematic. The observed 0.1 bar is smaller than the leeway the same instrument has on its own.
The example is deliberately the unfavourable case, because it is the one that raises most questions. As a rule, even a simple gauge shows a clear change upwards after the conversion, more or less pronounced depending on the chosen upgrade stage. In the sense of this article, that higher reading is no more reliable than the disappointing one. It merely agrees with what we measure on the test bench.
And that is only the one source of interference that can be quantified. The other three are not small, they are unknown, and that is exactly the difference. You cannot subtract them, cannot correct for them, and cannot even determine their sign. So what stands at the end is not "the engine got 0.1 bar worse," but: it isn't even established that the difference points in that direction at all.
For completeness, the reverse case, because it is just as common and questioned far less often: if the second gauge reads 1.0 instead of 0.8 bar, nobody welcomes a measurement uncertainty. The number is believed, because it delivers the expected result. Methodologically it is worth exactly as little as the disappointing one.
¶ How the industry itself handles this question
If you suspect we're setting the bar artificially high, it's worth looking at the hurdles the automotive industry places on its OWN measurements before trusting them. There's a complete body of rules for this — in the US, the MSA handbook of the automotive associations; in Germany, VDA Volume 5 — and its core idea is exactly the thesis of this article: every observed difference between two measurements consists of real change PLUS measurement system scatter, and as long as you don't know the second part, you don't know what you're comparing.
Before a measuring instrument is allowed to decide pass or fail in series production, it must therefore pass a formal capability study, the so-called Gage R&R study. This breaks down the measurement system's scatter into its components — repeatability (the same operator measures the same part repeatedly with the same instrument) and reproducibility (different operators measure the same part) — and the result is set in relation to the tolerance. The rating classes are unforgiving:
| Measurement system variation (%GRR) | Industry verdict |
|---|---|
| Up to 10% of tolerance | Acceptable |
| 10 to 30% | Conditionally acceptable, depending on application |
| Over 30% | Not acceptable, measurement system must be improved |
Hold this table next to a typical before-and-after measurement from the field: an uncalibrated instrument of unknown class, two different days, two oil temperatures, possibly two different hands on the valve. Nobody has ever determined the scatter of this "measurement system," and based on everything the previous chapters have shown, it would sit far beyond the 30 percent mark. Such a measurement setup would be thrown out in any series production plant in the world before it got to make its first decision. In a forum thread, it decides "the conversion doesn't work."
The same picture applies to reference conditions: the standard for engine power measurements (ISO 1585) not only defines a reference temperature of 25 degrees, it declares measurements outside a window of 15 to 35 degrees ambient temperature no longer comparable even after correction, even WITH a correction formula. Engine test benches actively condition oil and coolant circuits to target temperature, precisely because without this straitjacket no two runs would be comparable, and even such test benches, depending on equipment and calibration status, still carry tolerances of a few percent. In short: the strict rules we apply to comparison measurements aren't MMHP pedantry. They're the industry standard, just stated honestly.
¶ The cruelty of statistics, and the engines' final word
Let's add it up: four sources of interference, all changed simultaneously, none of them quantified. The measured difference between before and after is therefore a sum of the conversion effect, the temperature effect, the time effect and the instrument effect, with unknown signs. It can enlarge the true effect, shrink it, mask it, or invent it. In methodological terms: the comparison doesn't violate one boundary condition of reproducibility, it violates all of them, simultaneously. Hence our perhaps uncomfortable but honest formula: the number isn't wrong. It's meaningless.
And even if you could tame all four sources of interference, a fifth, fundamental veto remains, and the engines themselves speak it: no two series engines are alike. Manufacturing tolerances make every unit a hydraulic one-off, as we've documented in detail. The popular cross-comparison ("my buddy has the 'same' engine but 0.4 bar more") stands on even thinner ice than a comparison on your own vehicle — it compares two one-offs across four sources of interference. That's no longer a measurement, that's tea leaves with a pressure gauge.
¶ "But surely you can see it roughly"
A fair objection, and it deserves a nuanced answer. Yes: a total failure, a collapse of the supply, is visible even with simple means, that's what rough measurements are good for.
But for anything finer, the rough glance misleads in both directions. A measurement taken with colder oil can fake an improvement that doesn't exist, and just as easily mask a real improvement, because the comparison value arose under more favourable conditions. Especially treacherous is the widespread hope that such measurements could be used to assess the engine's WEAR CONDITION and, from that, deduce whether the smaller stage is enough. The nature of bearing damage itself argues against this: it doesn't develop as a gently declining curve you could read off, but stays inconspicuous for a long time until a threshold is exceeded, and then fails abruptly. An inconspicuous "before" reading is therefore no certificate of health, and this is exactly why we make our general stage recommendation.
Key point: an uncontrolled measurement always tells a story. You just never know if it's the true one.
¶ What a disappointing reading doesn't mean
A large share of the messages that reach us have the same trigger: after the conversion there is a number on the gauge that is smaller than hoped for, occasionally smaller than before. What can be read from it is less than it seems, and that cuts both ways.
First, what that number fundamentally cannot answer. Whether a pump delivers more is not a property of your engine, it is a property of the pump. It is measured on the pump test bench, on every unit built, regardless of which engine it later ends up in. That is exactly why we speak of percent of delivery rate and not of bar: the one belongs to us, the other to your engine.
And then the point where intuition leads astray. Oil pressure is flow resistance. A system pushing more oil through the same cross-sections redistributes that resistance, and it does so differently at every station of the circuit. It is possible for a single measuring point to read lower after the conversion while the supply downstream of it is better than before, because every station has its own truth. This is why we measure at several positions simultaneously and not wherever the adapter happens to fit.
That is not reassurance, it is context. A single reading after the conversion is not a verdict, neither a good one nor a bad one. It is one point out of a map, read off with an instrument that cannot resolve it, under conditions that were different the first time round. Anyone who wants to know what has changed needs more than one number, and that is not an excuse, it is the reason for all the effort we go to.
¶ If you send us measurements anyway
We regularly receive measured values and do look at them; often the curve shape or the surrounding circumstances hold a genuine clue, even if the absolute value is of little use. But for that we need the complete picture. A usable measurement log contains at least:
| Detail | Why it matters |
|---|---|
| Exact measuring point | Position determines the value |
| Oil temperature at time of measurement | Direct influence via viscosity |
| Engine speed(s) of the measurement | Pressure is speed-dependent |
| Instrument used | Class, damping, history |
| Oil type and age of the fill | Viscosity level, suspected dilution |
| Engine history | Mileage, repairs, rebuilds |
A single value without this information isn't a measurement, it's a number, and we'd be doing you a disservice if we built diagnoses from it.
¶ How reliable comparisons really come about
Oil system measurements only become comparable once you don't ignore the sources of interference but control them: identical, defined measuring positions, measurement runs within fixed temperature windows, a measurement system with known, documented behaviour, defined load profiles, and all of it as complete curve traces rather than single readings taken off a gauge, across multiple engines, so that series spread becomes visible instead of hidden. That's exactly why we built our own measurement technology, and exactly why our internal comparison metric, the VHFI, exists — to bring such controlled series onto a single, honestly comparable figure.
The rules by which we finally turn such a measurement series into a statement, which sections of a curve we weight and which we discard as not evaluable, we do not publish. Those rules grew out of dismantled engines and have been sharpened over years, and they are a good part of what separates our work from simply taking a reading.
None of this is a reproach to those who try it themselves, quite the opposite, the impulse to measure is the right one. It's the explanation for why we go to this considerable effort: without controlled conditions, there are no reliable statements about oil pressure. For anyone, ourselves included. The only difference is that we can control the conditions, and that we take a lot on ourselves to do it.
¶ See also
- Why standard commercial oil pressure gauges don't deliver reliable readings
- Oil pressure isn't just oil pressure: why measuring position matters
- Every engine is a one-off: manufacturing tolerances and oil pressure
- Why we don't promise bar values
- How we measure oil pressure: our own hardware, our own software
Transparency note: MMHP has been developing, testing and manufacturing its own products for the automotive industry for over 25 years, including solutions for the oil supply of VW TDI engines. The measurement-methodology background in this article is documented in our sources dossier; the support cases described are anonymised.