¶ Manufacturing Tolerances: Every Engine Is One of a Kind
¶ The key points at a glance
Two cars, same model, same engine, same year. You'd think both have the exact same engine inside. They don't. No two production engines are identical, and the reason lies deep in manufacturing itself: the tools that drill oil galleries, bore bearing housings and hone cylinders wear down as they work. An engine block machined with fresh tools has different dimensions and smoother surfaces than one produced just before a tool change. And because an engine is the sum of dozens of such operations, each with tools worn to a different degree, every single unit is a unique combination.
For oil supply, that's not a footnote. Oil flow through a plain bearing depends on the third power of the clearance height, so even the smallest dimensional differences have an outsized effect. Manufacturers know this and address it with their own system: they measure components after production and sort them into classes, visible for example as colour-coded bearing shells. Motorsport provides the counter-proof from the other direction: only when race engine builders individually rework every dimension (so-called blueprinting) do nominally identical engines deliver near-identical results.
The consequence for you: oil pressure figures from another vehicle, from a forum, or from a previous engine are not a valid reference for yours. You're always comparing two one-offs. That's why we work with measurement series across multiple engines rather than single readings, and why we design our systems to cover the entire spread, not just the ideal case.
That was the short answer. If you want to understand what's behind it, and pick up a few things along the way that you won't find in any forum, the long version starts here: with the numbers from machining technology, the tolerance tables, and the relationships that ultimately decide your oil pressure.
¶ A look inside the plant where your engine was built
Picture a night shift at an engine plant. On the transfer line, one cast-iron block after another passes through the same machining station. The tapping tool in spindle three may, at this point in its life, already have several thousand bores behind it — perhaps 15,000. It's still cutting, it still passes every inspection, no alarm is triggered. But it is no longer the tool it was at bore number one.
This is exactly where the story of why your engine is a one-off begins.
Cutting tools wear through four mechanisms that manufacturing engineering has understood for decades: abrasion (mechanical wear at the cutting edge), adhesion (material microscopically welds to the tool and tears away particles when it releases), diffusion (atoms migrate between workpiece and cutting edge under heat), and oxidation. This isn't a defect, it's planned, everyday reality. Industry manages it through what's called tool life: a tool works until its wear mark reaches a defined width — in practice, per VDI 3321, usually 0.3 millimetres, or 0.2 millimetres for fine machining. Then it's replaced. How long that takes is described by the Taylor equation, one of the oldest formulas in manufacturing engineering: the faster a tool cuts, the more drastically its life shortens. Every production plan is a compromise between cycle time and tool cost.
Now for the scale involved. From a documented case study of series engine block production (thread machining in cast iron, a plant producing 100,000 engine blocks per year): a classic high-speed steel tool achieved a tool life of 18,450 threads, a modern indexable-head system over 117,000. Between "freshly mounted" and "replacement limit" lie tens of thousands of bores. Somewhere along that long stretch, every single block was made. Yours, perhaps, at bore 500. Your neighbour's, at bore 17,000.
If the machining result stayed identical across the entire tool life, none of this would matter. But it doesn't stay identical, and the differences have been measured.
¶ What tool wear leaves behind on the component
Machining studies trace the relationship precisely: tool wear and surface roughness rise in parallel over tool life. One example from steel machining makes the scale tangible. With a fresh edge, the tool produced a surface roughness of Ra 0.23 micrometres. At a wear mark of just 0.1 millimetres — still well BEFORE the usual replacement limit — it was already Ra 2.2 micrometres. Almost tenfold. At higher cutting speed, the same test saw the value rise to Ra 2.92.
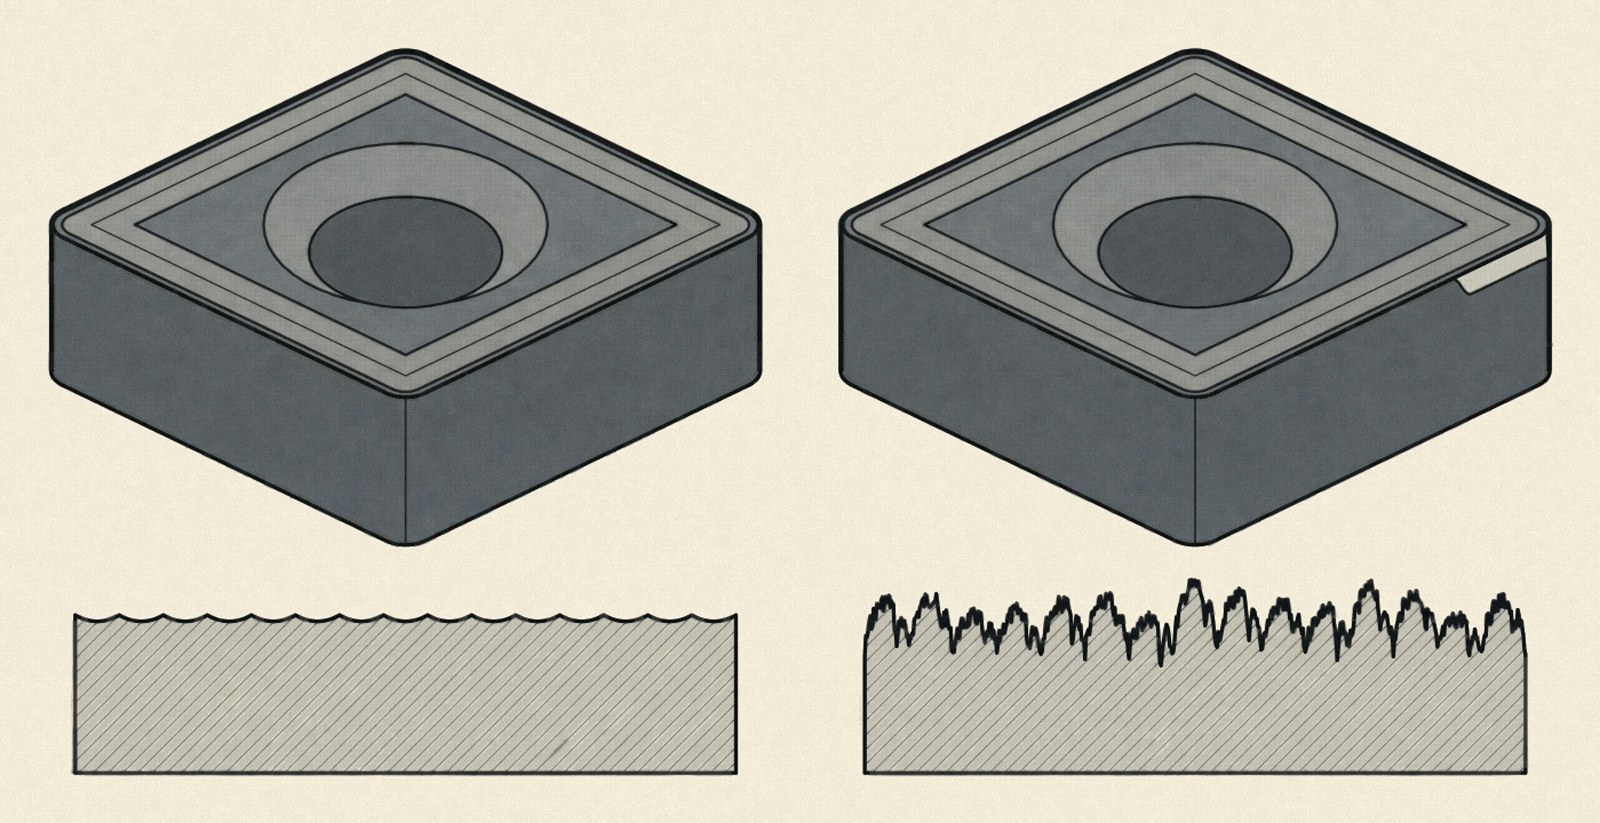
Left a fresh cutting edge, right the same insert with a wear land on the flank face below the cutting edge (drawn enlarged). Below, the surface each edge leaves behind.
Key point: a tool operating within its permitted service life can produce surfaces that differ by a factor of ten, and both components are considered perfectly fine.
Dimensions themselves also drift. In deep-hole drilling, diameter shifts of 13 micrometres across the drilling depth were documented, with a further 22 micrometres added at higher feed rates. That sounds like nothing — a human hair measures roughly 70 micrometres. But keep these numbers in mind, because further down they meet a formula that turns "nothing" into "decisive."
An engine block doesn't go through one such operation, but dozens: oil galleries are drilled, the bearing bore is bored and finish-machined, cylinders are honed, threads are cut, sealing surfaces are milled. Each of these tools has its own life cycle, offset from all the others. Block A meets a fresh honing tool and a tired gallery drill; block B meets the reverse combination. Mathematically, this is a combinatorial problem with tens of thousands of possible states. Practically, it means: the exact combination of actual dimensions and surfaces in your engine existed exactly once.
¶ Tolerance isn't sloppiness, it's physics priced in
At this point you might ask: why not just manufacture more precisely? The answer lies in the international tolerance system ISO 286, used across all of mechanical engineering. It divides achievable accuracy into so-called standard tolerance grades, from IT01 (measuring-instrument level) to IT18 (rough sheet metal). And it makes a statement that surprises many: the permitted deviation grows with component size, according to a standardised formula.
The table below shows the standard tolerances for three nominal size ranges that appear constantly in engine construction (small oil galleries, main bearing diameters, cylinder bores):
| Nominal size range | IT5 | IT6 | IT7 | IT8 | IT9 | IT10 | IT11 |
|---|---|---|---|---|---|---|---|
| 6 to 10 mm | 4 µm | 6 µm | 9 µm | 15 µm | 22 µm | 36 µm | 58 µm |
| 50 to 80 mm | 11 µm | 16 µm | 25 µm | 39 µm | 62 µm | 100 µm | 160 µm |
| 80 to 120 mm | 15 µm | 22 µm | 35 µm | 54 µm | 87 µm | 140 µm | 220 µm |
Three things about this table reward a second look. First, the range: between IT5 and IT11, at the same nominal size, there's a factor of 15. Which grade applies depends on the manufacturing process. Simple drilling typically delivers IT11 to IT13; only reaming brings a bore up to IT7. A "drilled oil gallery" and a "reamed oil gallery" are therefore two entirely different precision worlds, even though both look the same in cross-section. Second, the size dependency: a 100-millimetre bore is allowed to vary almost four times as much as an 8-millimetre bore at the same tolerance grade. The standard honestly reflects what's physically achievable — large dimensions are harder to hit exactly than small ones. Third, and this is the core point: everything within these bands is GOOD. A main bearing at the upper edge of IT6 and one at the lower edge are both manufactured without error, yet they differ by 16 micrometres.
More precise manufacturing would certainly be technically possible. It just costs exponentially more: each finer IT grade roughly doubles the effort in machinery, measurement technology and scrap. At 100,000 blocks a year, that decides outcomes worth millions. Series production therefore deliberately chooses the economical tolerance band and lives with the spread. A perfectly rational decision — you just need to know its consequence.
Where the standard gets its numbers from is itself a piece of manufacturing physics. The standard tolerance unit is calculated from a formula in which the nominal size sits under a cube root (i = 0.45 times the cube root of D, plus a small linear term). The cube root isn't arbitrary: it reflects that manufacturing errors grow with component size, but noticeably more slowly than size itself, because thermal expansion, tool deflection and measurement uncertainty only partially scale up with dimension. An IT grade is then simply a multiple of this unit — IT6, for example, is ten times it, IT7 sixteen times. The entire worldwide tolerance standard therefore rests on a single empirical curve describing how precise machines can realistically be. That, too, is a quiet admission: perfect dimensions don't exist, only honestly quantified imprecision.
¶ Surfaces: the mountain range nobody sees
Dimensions are half the truth. The other half is the surface, and that's the topic that almost never comes up in public discussions about engines, even though it plays a decisive role in flow and lubrication.
Under a microscope, no machined surface is smooth. It's a mountain range of grooves, peaks and valleys, measured by standardised parameters. The two most common: Ra, the arithmetic mean roughness, averages all deviations and is correspondingly forgiving — individual deep grooves vanish into the mean. Rz, the mean roughness depth, is considerably more sensitive to outliers; as a rule of thumb, Rz runs at four to seven times Ra. But to really understand surfaces, you need a third family: the plateau parameters Rpk, Rk and Rvk per DIN EN ISO 13565. They break the mountain range into three zones with three entirely different jobs: Rpk describes the peaks, which are the first to wear away during running-in. Rk is the core zone that actually bears the load in operation. And Rvk describes the depth of the valleys — and these aren't a flaw, they're the surface's oil reservoir: the lubricant film sits in these grooves.
A documented reference profile of a cylinder bore surface shows just how deliberately this is set: Rk 0.4 micrometres load-bearing core, Rpk only 0.15 micrometres of running-in peaks, but Rvk 1.2 micrometres of groove depth. The valleys there are three times as deep as the core is rough — by design. This is exactly what plateau honing produces: a mirror-smooth bearing surface with micro-scale oil channels cut into it. How honing produces this profile and what it does during running-in is shown in Stuck Piston Rings: Why Rings Seize and Burn Oil.

The reference profile to one height scale: the valleys are three times as deep as the core is rough. Schematic, greatly exaggerated vertically.
What each manufacturing process can actually deliver in surface quality is listed in every engineering handbook, and the ranges are remarkable:
| Process | Achievable roughness Ra (µm) |
|---|---|
| Drilling (into solid material) | 1.6 to 12.5 |
| Reaming | 0.2 to 2.1 |
| Turning (longitudinal turning) | 0.2 to 12.5 |
| Milling | 0.4 to 12.5 |
| Grinding (cylindrical longitudinal grinding) | 0.012 to 0.8 |
| Honing (long-stroke honing) | 0.006 to 0.65 |
| Lapping | 0.006 to 0.2 |
Here too, the edges are worth a glance. According to the handbook, an oil gallery drilled into solid material can have the roughest surfaces in the entire engine, at Ra 1.6 to 12.5 — that's a factor of eight WITHIN the permitted window, depending on tool condition. Honing, by contrast, reaches down to Ra 0.006, a thousand times finer than the upper end of drilling. Now connect this table to the previous chapter: WHERE within the permitted window a given gallery ends up is largely determined by the wear state of the tool on that particular production day. The tenfold jump from Ra 0.23 to 2.2 in the study above plays out entirely within these handbook ranges.
¶ The manufacturers' answer: sorting instead of tighter manufacturing
The engine manufacturers naturally know all this better than anyone. Their answer to the spread is a system many home mechanics have held in their hands without realising its significance: classification.
For the crank assembly, it works like this: after manufacturing, every crankshaft journal and every bearing bore is individually measured and assigned to a tolerance class, marked with a colour dot or code on the component. Matching bearing shells come in finely graduated thicknesses, also colour-coded. Only the PAIRING of matching classes produces the intended bearing clearance. A journal at the lower end of the dimensional range gets a thicker shell; one at the upper end gets a thinner one, and both engines end up in the same clearance window. This is a lived admission of series spread: if every part were dimensionally identical, nobody would need this elaborate sorting and pairing system.

The thickness step sits in the steel back of the shell; only the matching pair gives the intended clearance. Schematic, differences greatly enlarged.
How tight this clearance window actually is shows in the workshop tool used to check it: Plastigage, a calibrated plastic thread placed between journal and shell and flattened by torquing the bearing down. Its width after opening reveals the clearance:
| Plastigage type | Measuring range | Typical use |
|---|---|---|
| Green (PG-1) | 0.025 to 0.076 mm | Passenger car engines |
| Red (PR-1) | 0.05 to 0.15 mm | Commercial vehicles |
| Blue (PB-1) | 0.10 to 0.23 mm | Large engines |
The green passenger-car strip starts at 25 micrometres. The entire healthy clearance window of a passenger car plain bearing therefore plays out at a scale where the dimensional drift from manufacturing (the 13 to 22 micrometres from deep-hole drilling, the 16-micrometre IT6 band on bearing diameter) is no longer a footnote, but a relevant share of the whole. For reference: industry practice for passenger car engines cites new-condition radial clearances of roughly 15 to 40 micrometres at the main bearings, with even tighter windows at the connecting rod bearings. The intended clearance and the unavoidable manufacturing spread sit in the same order of magnitude, and that's precisely why manufacturers run this entire classification exercise in the first place.
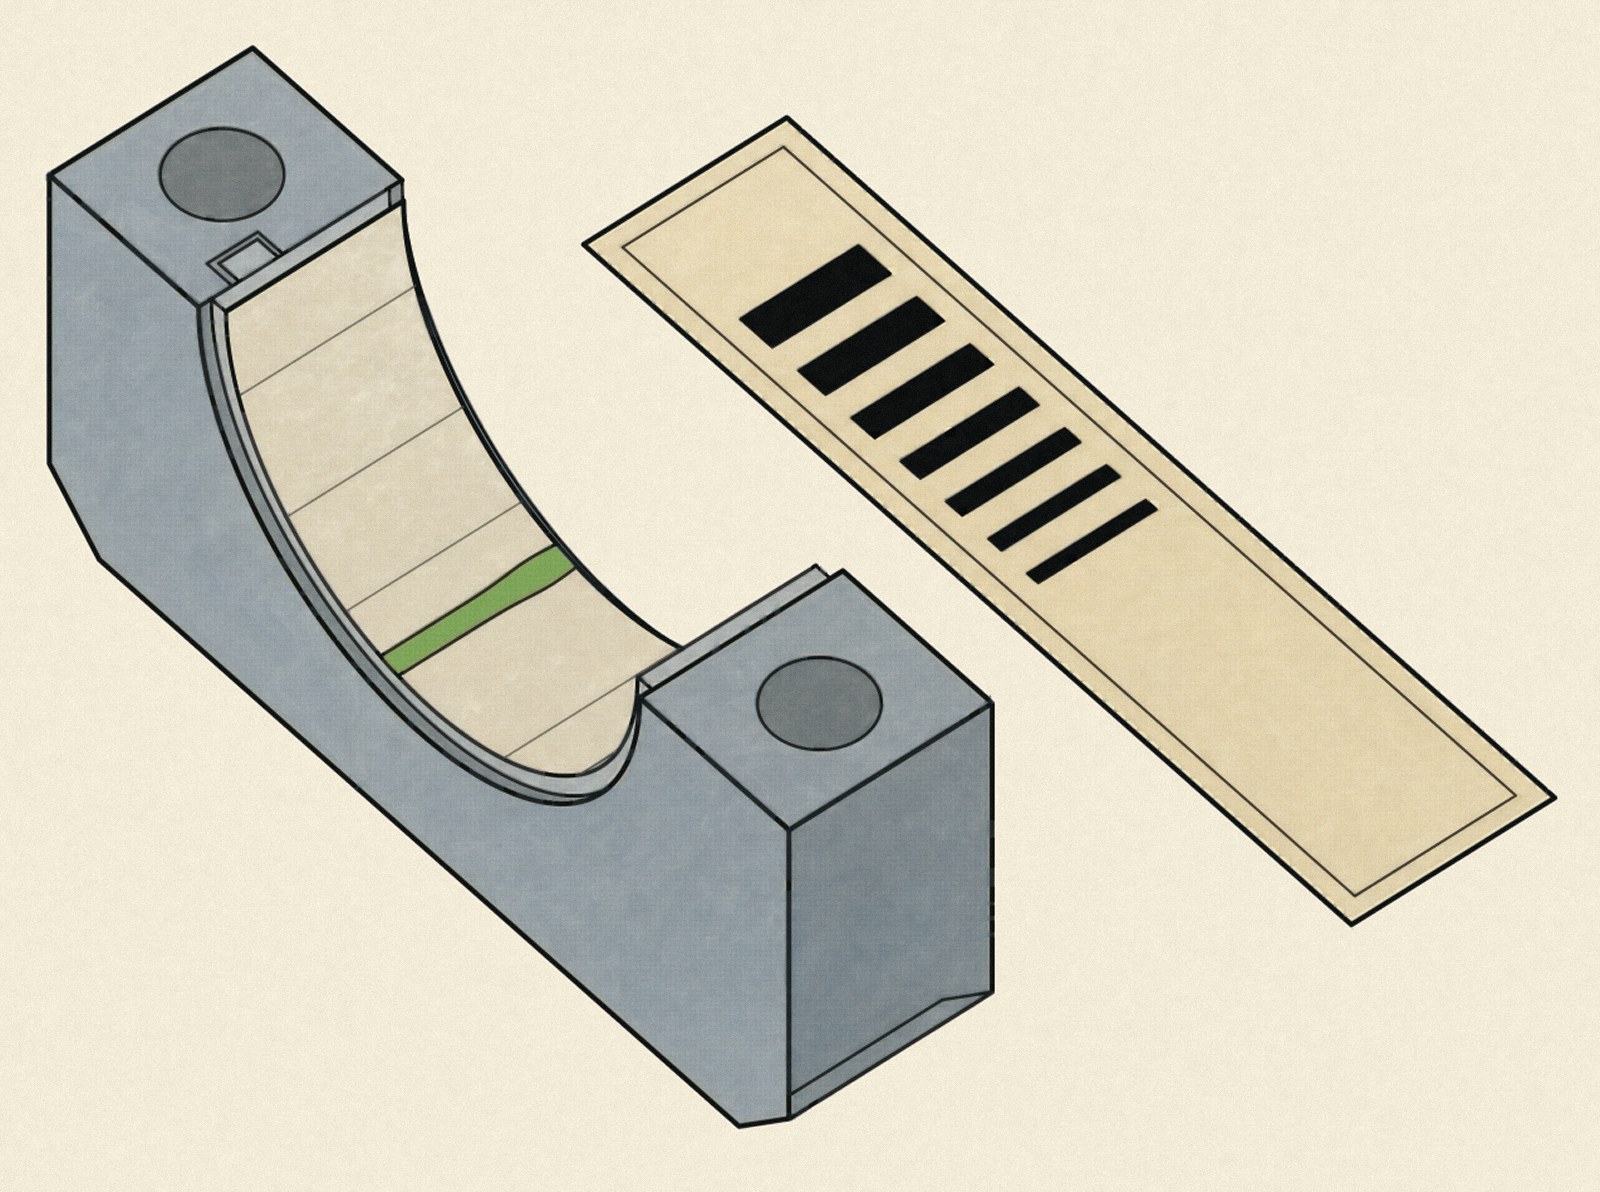
After tightening and removing the cap: the width of the flattened strip is compared with the scale on the envelope at its widest point.
¶ Then comes operation: running-in, settling, ageing
If you now think the engine's fingerprint is at least frozen at delivery, this chapter has to disappoint you. It keeps changing, and fastest right at the start.
Recall the plateau parameters: Rpk describes the surface's fine peaks, and the definition explicitly states that this zone is worn away first during running-in. That's exactly what happens throughout the engine simultaneously in the first hundred operating hours. Running surfaces smooth out their running-in peaks, bearing surfaces polish themselves to their operating geometry, gaskets settle, bolted joints relax minutely. Each of these processes shifts clearances and resistances by micrometres, and by now we know what micrometres mean. An engine with 500 kilometres and the same engine with 15,000 kilometres are not hydraulically the same unit, even though both are still essentially new.
After that, slow ageing takes over, and it's anything but uniform. Wear grows preferentially where manufacturing already sat at the unfavourable edge: the slightly looser bearing lets more oil escape, runs marginally hotter as a result with a thinner lubricant film, and therefore wears faster than its tighter neighbouring bearing. The cube-power mechanism, covered in more detail shortly, turns small starting differences into large operational differences over the years. Two engines that left the factory nearly identical can drift measurably apart hydraulically over 150,000 kilometres. Manufacturing spread is only the seed; operation waters it.
¶ From single dimension to chain: tolerances stack up
So far we've considered each machining operation in isolation. But an engine is a stack of dozens of toleranced parts assembled together, and when they're assembled, the uncertainties add up.
A main bearing, for example, is not a single tolerance but a chain: the bore of the bearing housing in the block, the thickness of the upper bearing shell, the thickness of the lower one, the journal diameter of the crankshaft, plus the deformation of the bearing cap under torque, which in turn depends on the spread of tightening torque and the friction of the bolt threads. Each link in this chain has its own permitted band. In a lucky case, the deviations partially cancel out; in a worst case, they add up, and statistics reliably ensure that both cases occur across a production run of a hundred thousand engines. Classification defuses the largest links in this chain, but it doesn't capture nearly all of them. What remains is a further contribution to the one-off character — one that can't be fully eliminated even with perfect individual-part measurement, because it only arises during assembly.

Four dimensions, one chain: each stays within its permitted band. Whether the deviations cancel out or add up to a wide or tight clearance is only decided at assembly.
¶ Why micrometres decide bar
Up to this point, this has been manufacturing theory. Now comes the step that connects all of it to your oil pressure, and it has real teeth.
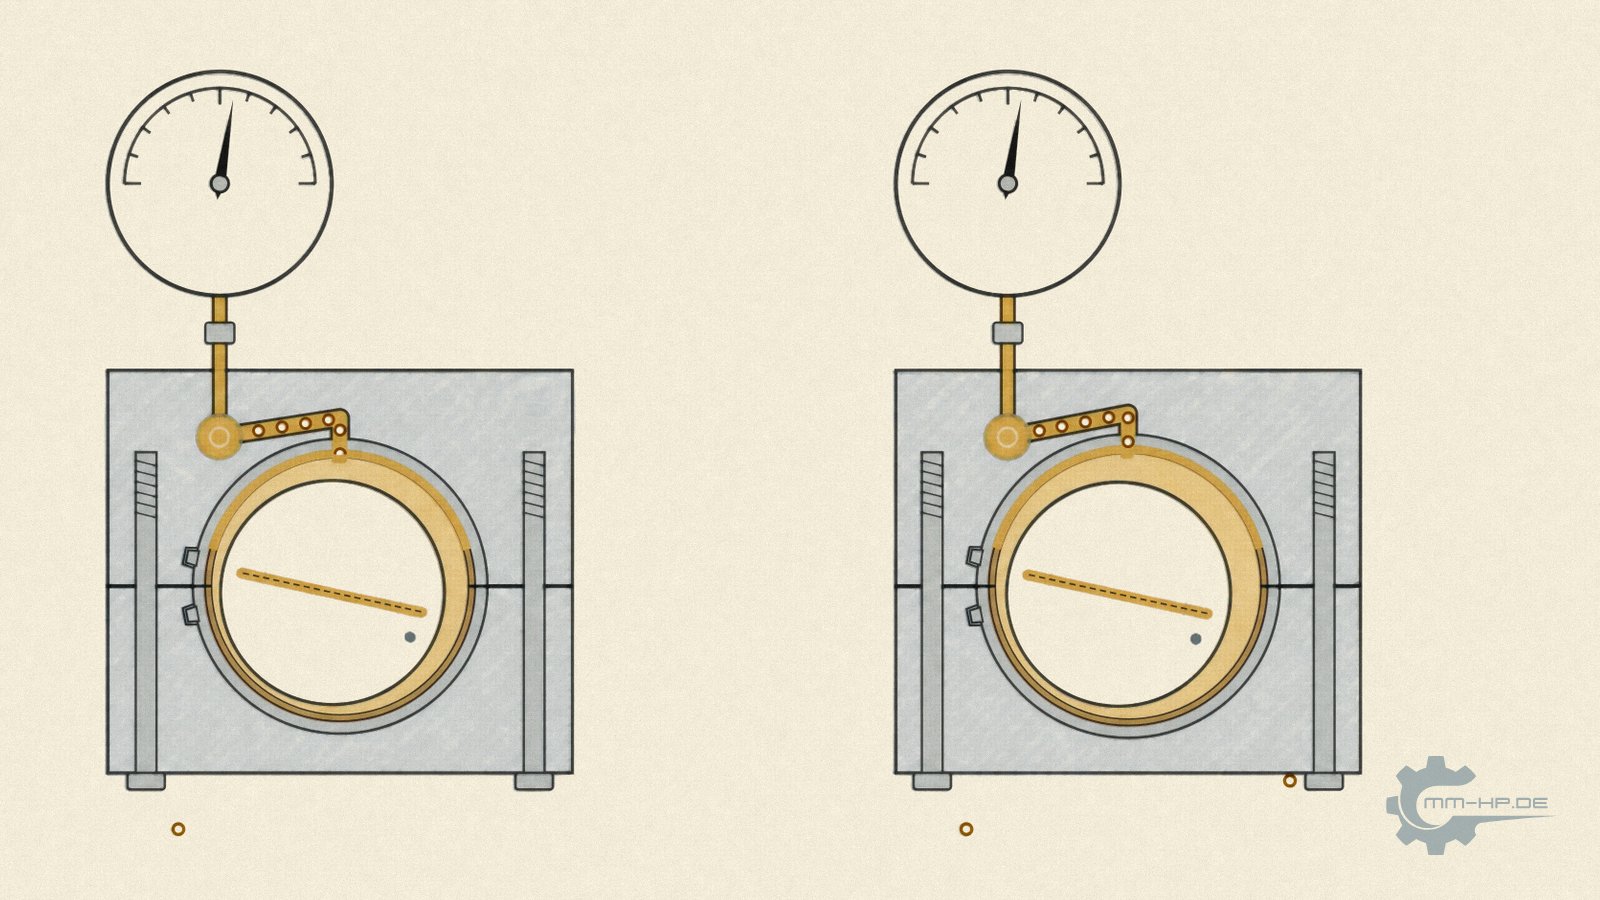
The oil flow that escapes through a hydrodynamic plain bearing follows the Reynolds equation of lubrication theory, and in it, the clearance height appears to the THIRD power. In plain language: if the bearing clearance doubles, the oil flowing through the gap doesn't double, it increases eightfold. A bearing whose clearance is just 26 percent above that of a comparison bearing already lets through, by calculation, double the flow. The micrometres from the chapters above therefore don't enter the oil balance linearly, they enter cubically.

26 percent more clearance, twice the oil flow: the gap height enters the leakage cubed. Both bearings are fine; they merely sit at different points of their tolerance band.
Key point: for a plain bearing, clearance height counts to the power of three. A few thousandths of a millimetre difference in clearance mean double-digit percentage differences in oil flow.
The same principle, in milder form, applies to the galleries: in flow theory, the relative roughness of a wall determines the friction loss of a pipe flow (this is the content of the famous Moody diagram). A gallery from the rough end of the drilling window lets through less oil at the same pressure than its smoothly reamed counterpart — permanently, over the engine's entire service life.
An engine has five main bearings, four connecting rod bearings, camshaft bearings, injector nozzles and metres of galleries, and at every one of these stations, manufacturing rolls the dice within its permitted bands. The sum of all this is what we call the hydraulic fingerprint of an engine: every unit distributes pressure and flow rate measurably differently across its supply chain (read here how this chain is structured). Two brand-new, defect-free engines of the same type show different pressures at the same measuring point, not because one is worse, but because both are different within the norm.
¶ A case study in hundredths: the oil pump itself
How concretely tolerance bands decide function is shown, of all things, by the component meant to generate the pressure. An oil pump lives on the tightness of its internal clearances: the smaller the clearance between the pumping rotors and the housing, the less oil leaks internally back from the pressure side to the suction side, and the more of each revolution arrives in the engine as delivered flow. Workshop literature quotes gear/rotor backlash values for new pumps starting at roughly 0.03 to 0.05 millimetres, with wear limits, depending on design, between 0.08 and 0.20 millimetres. Between "as-new" and "worn out," this component therefore spans a range of only about a tenth of a millimetre, and manufacturing rolls the dice on its starting position within this window just as it does for every bearing.
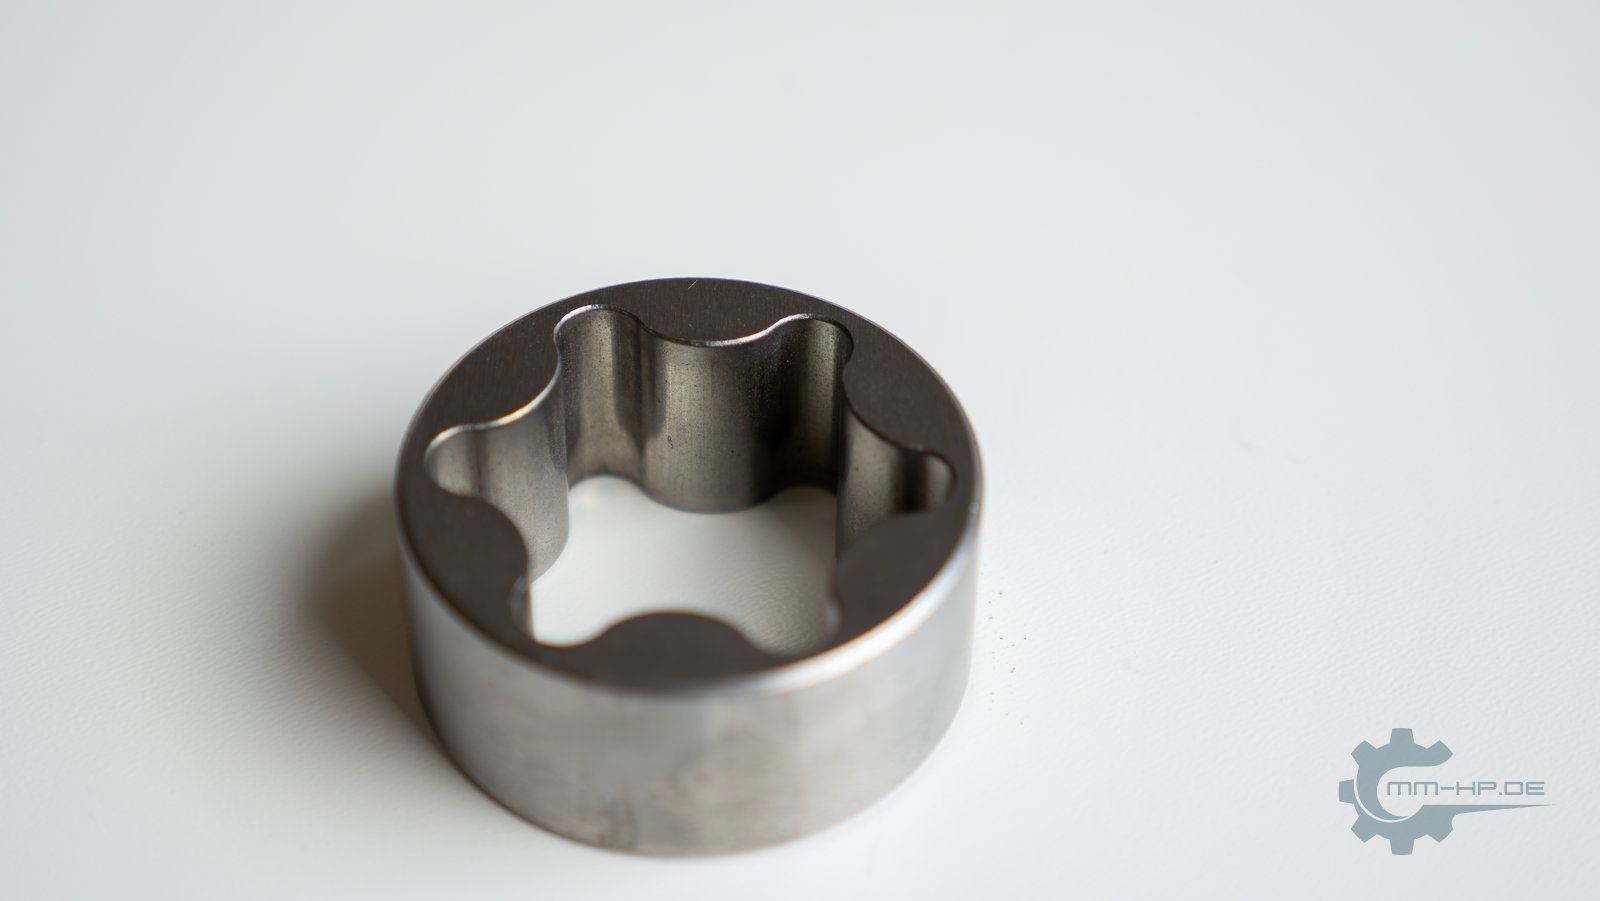
New part, own photo. The outer rotor of an oil pump: its pockets and the inner rotor fit each other to within hundredths of a millimetre.
This has a consequence that hardly anyone accounts for: series-production pumps themselves also spread. A pump whose clearances happen to sit at the upper end of tolerance delivers measurably less effective flow from day one than its tightly manufactured sister unit, and reaches its wear limit correspondingly sooner. The "hydraulic fingerprint" of an engine therefore arises at both ends of the circuit simultaneously — at the consumers (the bearings) and at the source (the pump) — and both spreads can either add up or mask each other. An engine with a tight pump and loose bearings can show the same idle pressure as one with a loose pump and tight bearings, with completely different outlooks for the future. How a pump works internally and how it's tested is covered in its own fundamentals article.
And a second consequence follows from this chapter: every engine rebuild is a second pass through exactly this tolerance game, this time with workshop tools instead of a transfer line. Ground crankshaft journals with undersize shells, line-bored housings with oversize shells, reused or new pumps — each of these decisions introduces new dimensions into the chain. A rebuilt engine is therefore not a "restored series condition," but a new one-off with its own, unknown tolerance position, with all the consequences for oil pressure that we describe in a dedicated article.
¶ The proof from motorsport
If this all sounds theoretical to you: there's an entire discipline that lives off the existence of exactly this spread, and it's as old as motorsport itself. It's called blueprinting.
In blueprinting, a series-production engine is completely disassembled and every single dimension is captured with micrometers, bore gauges and dial indicators. Then it's reworked — not to "within tolerance," but to a tight, uniform target, bearing by bearing, bore by bore. The technical literature is also open about where the deviations being eliminated come from: wear of the cutting tools, wear of the grinding wheels, machine wear, even wear of the plant's own measuring equipment. In other words, exactly the mechanisms from the first chapter.
The effect is documented. For near-series components, industry sources cite a power spread of roughly ten to fifteen percent between nominally identical units. Cosworth, by contrast, one of the most renowned race engine builders, stated that for its ChampCar turbo engines producing over 700 hp, every unit fell within about one percent on the dyno, roughly seven hp. This difference, fifteen percent versus one, is nothing other than series spread, made visible by its elimination. The effort required is enormous, which is why only motorsport goes to that length.
¶ What this means for your measured values
Let's draw the threads together, because three very practical consequences follow from this.
First: an oil pressure figure from a forum, from a friend with the "same" engine, or from your previous unit is not a reference. It describes a different one-off. Even under perfectly identical conditions (same oil temperature, same measuring point, same instrument — which practically never happens), the manufacturing differences remain an unknown quantity in the comparison (why such comparisons also fail on measurement-technical grounds is explained here).
Second: this is exactly why we don't quote blanket bar target values for "the" engine, however much we'd like to. Any such figure would be wrong for a portion of real engines, even though nothing is wrong with them (the full reasoning here).
Third, and this is often overlooked: the spread continues throughout the engine's life. Wear doesn't enlarge clearances evenly, but fastest where manufacturing already sat at the upper edge — the cube-power mechanism amplifies outliers. Two engines that started out only slightly apart can be hydraulically worlds apart after 150,000 kilometres.
¶ How we handle the spread
For our development work, none of this means measuring is pointless. On the contrary, it means you have to KNOW the spread before you design anything.
That's why we buy and disassemble series-production engines and measure them systematically — not just nominal dimensions, but actual tolerance positions and surfaces, right down into oil galleries and bearing bores. Only across multiple units does it become clear how wide the real field is within which a retrofit system has to work. Our measurement series on running engines (using our own multi-position measurement technology) then make this same spread visible in the pressure trace, and our internal comparison metric, the VHFI, converts it into a single figure that allows an honest comparison between series condition and retrofit solution.
The spread also implies a design philosophy: a system that's only sufficient for the average engine is too weak for half of all engines. Our retrofit pumps are therefore sized for the unfavourable end of the field — for the engine with wide clearances, rough galleries and a worn-out 180,000 kilometres, not for the dyno's showpiece unit. How large these reserves are, and which measured values over the years have gone into this design, we keep to ourselves. This knowledge has grown out of more than a decade of teardown and measurement work and is part of our company's value, just as every manufacturer protects its know-how. What matters is: the result of this work is built into every system we deliver.
¶ See also
- Oil pressure isn't just oil pressure: why measuring position matters
- Why measurements before and after a retrofit can't be compared
- Why we don't promise bar values
- We buy engines to take them apart: research at MMHP
- Glossary of technical terms
Transparency note: MMHP has been developing, testing and manufacturing its own products for the automotive industry for over 25 years, including solutions for the oil supply of VW TDI engines. The manufacturing and standards background in this article reflects general state of the art and is documented in the cited standards and studies; the conclusions for oil supply and the design philosophy described are based on our own measurement and teardown work.