¶ Oil Pressure in Bar: Why We Don't Promise Absolute Figures
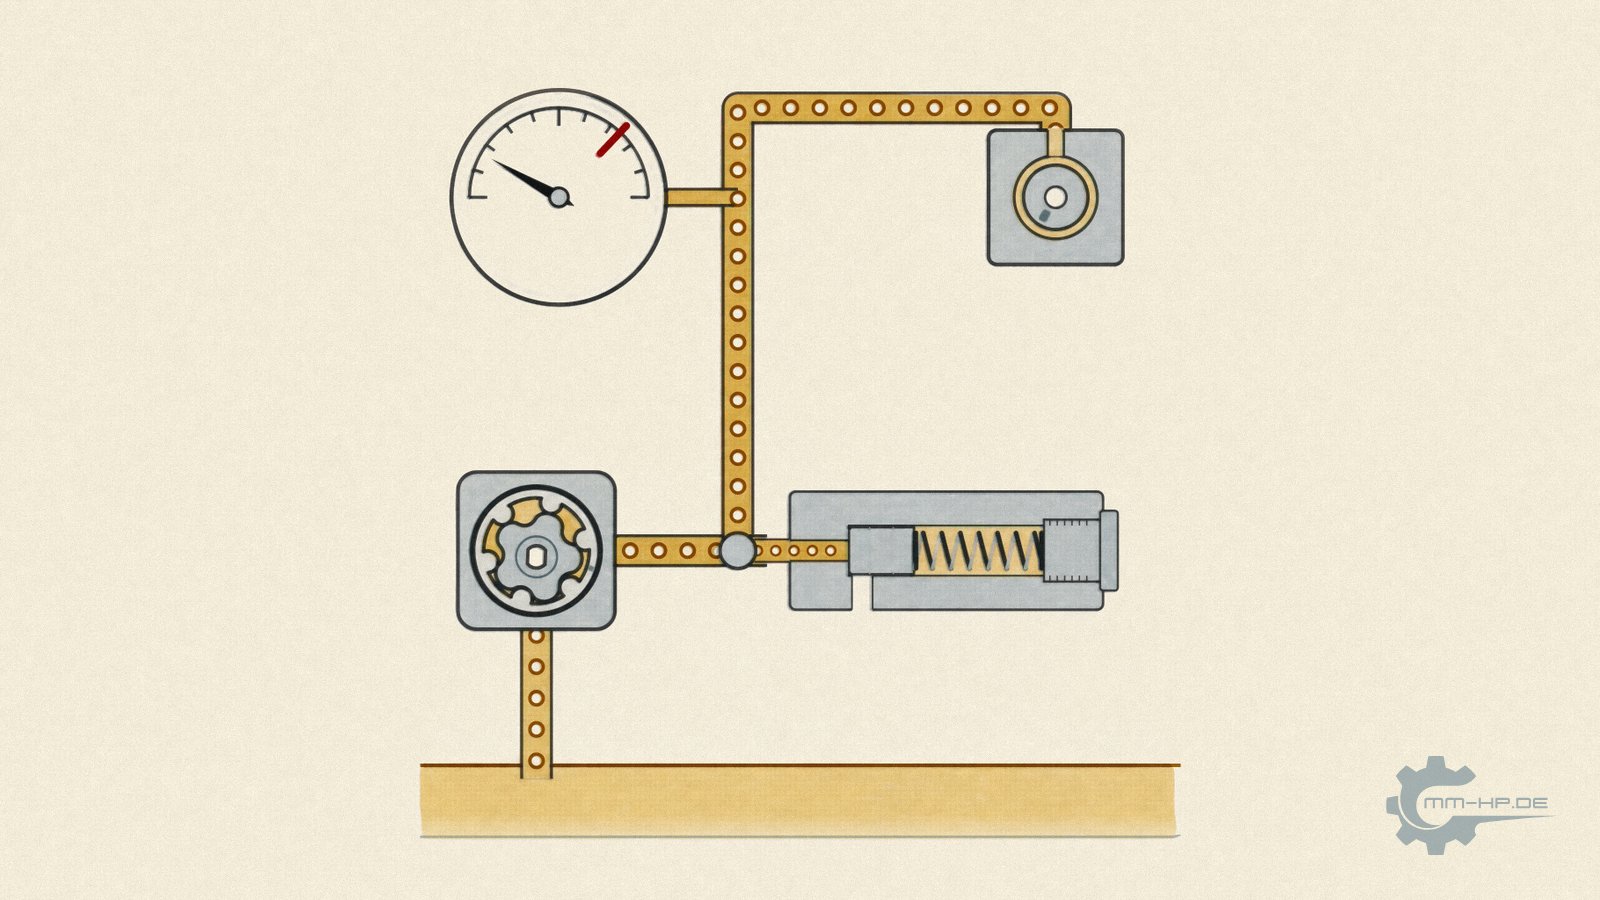
Schematic. The animation is further down in this article.
¶ The key points at a glance
It's the question that reaches our support team most often, by a wide margin: "How many bar more oil pressure does your system give me?" The question is entirely legitimate, and yet we don't answer it with a number. Not because we don't know it, but because any blanket figure would be a false statement, inevitably too high for some engines and too low for others.
The reason lies in the physics: our percentage figures (Stage 1 at 35, Stage 2 at 116 percent extra delivery) describe a property of the PUMP, namely how much more oil it moves per revolution. This figure is exact and holds for every unit built. What PRESSURE results from it, on the other hand, is decided by the engine around it: the measuring point (pressure drops in stages along the supply chain), the conditions (oil temperature and oil condition shift every reading), and the individual unit itself (no series-production engine is quite like another). Popular back-of-envelope sums like "0.7 bar standard value plus 35 percent equals 0.9 bar" also fail because pressure doesn't scale linearly with delivery volume, and because the pressure relief valve (PRV) caps it from above in any case, which incidentally is also why the common worry about "too much pressure" is unfounded: over-supply is ruled out by design.
What we promise instead is the character of the systems, measured across many engines: Stage 1 lifts the oil supply out of the critical range, Stage 2 brings the system into a stable, thermally relieved state with reserves for every operating condition. Less catchy than "3.2 bar at 2,000 rpm", granted. But it's true, for every engine.
The long version works through why the obvious back-of-envelope sums are misleading, answers the over-pressure worry in full, and explains why a manufacturer that measures constantly is precisely the one that doesn't promise measured values.
¶ The question of all questions
When we sort our support inbox by topic, one question sits alone at the top, phrased a hundred different ways: how many bar does this give me? What does the engine show at idle afterwards? Can you send me a before-and-after table? It's asked by laypeople and professionals alike, by sceptics and by people ready to buy, and it is the most reasonable question in the world, because anyone investing money wants to see the effect quantified.
That makes our answer, which has stayed the same for years, all the more in need of explanation: we don't quote bar figures, we quote percentages of delivery rate. This isn't an evasive manoeuvre or marketing fog, it's the result of a trade-off that we lay out in full in this article. By the end you still won't have the number you're looking for. But you'll know why anyone who promises it to you either isn't measuring, or isn't being honest.
¶ What our percentage figures mean, and what a bar value would have to mean
An engine oil pump is a positive-displacement pump: per revolution it pushes a fixed volume of oil into the passage system, stubbornly and repeatably. When we say Stage 2 delivers 116 percent more, that's a statement about exactly this property, verifiable on any pump test bench, valid for every unit built, regardless of which engine it ends up in. It's a statement about OUR product.
A bar value, on the other hand, would be a statement about YOUR engine, because pressure only comes into being there: as the response of the passage system, the bearing clearances, the nozzles and valves, to the volume flow delivered, a cascade we've described in detail elsewhere. The same pump produces different pressures in a tight, fresh engine than in a worn one with wide clearances, different pressures at a measuring point near the front than at the back, different pressures with hot oil than with cold. A promised bar value would therefore be a promise about a system we've never seen, about your measuring point, your oil temperature, your state of wear. There's no honest way to do that.
¶ The back-of-envelope sum, and why it fails twice over
We know the obvious calculation from support, it comes up regularly: "My engine shows 0.7 bar warm at idle. Plus 35 percent is 0.9 bar. Hardly seems worth it." The calculation is understandable, and it's wrong on two levels.
Level one: pressure doesn't scale linearly with delivery volume. An engine's passage system isn't a rigid resistor, it's a network of pressure-dependent consumers, of clearances whose outflow responds to the third power, of valves that open and close. More delivery volume shifts the ENTIRE balance of this system, noticeably at some points, barely at all at others, and on top of that the distribution shifts again with engine speed and temperature. What reading results at a given point can't be worked out with simple proportional maths, only measured, across many data points and under controlled conditions.

Same extra delivery, three measuring points: the gain is different at each one and changes with engine speed. At the opening pressure, more delivery brings hardly any more pressure.
Level two: even if the effect at one point were known exactly, the starting value for the sum would be shaky. The "0.7 bar" typically comes from a sluggish, uncalibrated workshop gauge at an unknown oil temperature, measured at some point or other. On the usual 10-bar scale of a test kit, that value even sits below the range for which DIN EN 837-1 still guarantees any accuracy at all for a gauge with a pointer stop, as explained in the gauge article. Doing decimal-place arithmetic on a foundation like that multiplies uncertainty by wishful thinking.
Rule of thumb: percentage of delivery rate is a property of our pump. Bar is a property of your engine. We only promise what belongs to us.
¶ Three reasons why "your" bar value doesn't exist
In case the short version went by too fast, here are the three disturbing variables individually, each with its own in-depth article:
The measuring point. Pressure drops in stages along the supply chain, documented to drop by as much as half between the main oil gallery and the connecting-rod bearing. A figure without a location is worthless, and with a location it only holds exactly there. Details
The conditions. Oil temperature, oil grade, oil condition and engine speed shift every reading, cold oil fakes high values, diluted oil pulls them down. The same engine gives different figures in January than in July. Details
The individual unit. Manufacturing tolerances turn every series-production engine into a hydraulic one-off, two identical, healthy engines show different pressures at the same point. A promised value would fail to materialise for some customers even though their system is working flawlessly, and would be exceeded for others, which is just as confusing. Details
¶ The other worry: "isn't that much delivery TOO much?"
Interestingly, the numbers question also reaches us with the opposite sign, especially regarding Stage 2 and its 116 percent: can the engine handle that? Will something burst? Won't that blow out the plastic oil filter housing? This worry deserves a thorough answer too, because it rests on the same misunderstanding, equating delivery volume with pressure.
An oil circuit isn't open-ended at the top: the pressure relief valve caps system pressure, once pressure reaches the regulating limit, excess oil is shunted straight back to the sump. A stronger pump therefore doesn't shift the pressure ceiling, it ensures that the system doesn't drop below a healthy level in the first place even under unfavourable conditions, hot thin oil, high load, worn clearances. Over-supply is ruled out by design, the reserve works downward, not upward. And on the housing question: the standard oil-filter and cooler housings on these engines are designed for continuous pressures well above anything that occurs in regulated operation, in our testing experience they permanently withstand more than double the usual operating pressures. Stage 2 isn't a stress test for the engine, it's its safety net, and on the CFCA it's even mandatory for good reason.

Same spring, same opening pressure: the stronger pump reaches the mark earlier, but the pressure barely rises any higher. Whatever the engine does not take flows back into the oil pan as oil.
¶ What a credible bar figure would require
You can also turn this article's entire argument around constructively and ask: what would actually have to happen for a bar promise to BE credible? The answer shows why it doesn't exist, and it shows it more precisely than any counter-argument could.
A robust pressure figure would need a complete set of reference conditions, the way test standards define them. The standard for engine power measurement, for instance, doesn't just name a reference temperature, it declares measurements taken outside a narrow ambient window incomparable outright. Applied to oil pressure, an honest promise would have to read roughly like this: "X bar, measured at the main oil gallery upstream of the bearings, at exactly Y degrees oil temperature, engine speed Z, with fresh oil to VW 507 00, on an engine with defined, measured bearing clearances, taken with calibrated instrumentation of documented uncertainty." Every one of these clauses is necessary, because each one names a variable that shifts the value. And it's on the last clause that the promise finally falls apart: nobody knows the bearing clearances of YOUR engine without taking it apart.
A bar figure without this apparatus of footnotes, then, isn't a bolder version of our percentage figure, it's a figure with the footnotes left out. The market supplies plenty of those, and we understand the sales pressure behind it: a concrete number closes a sale, an honest caveat opens up questions. We've chosen the questions anyway, because a promise that inevitably can't come true for some customers isn't, in our view, a promise at all, it's a deferred disappointment, and disappointments of this kind turn up a year later as a "doesn't do anything" thread in some forum, where they harm everyone, including the customers for whom everything worked perfectly.
¶ What we promise instead, and why that's worth more
Internally, we're practically swimming in bar values: our multi-position measurement technology generates them by the million, across many engines, positions and temperature windows, condensed into our comparative metric, the VHFI. It's exactly this body of data that the statement we're happy to make publicly comes from, and it's a description of character rather than a pinpoint figure: Stage 1 lifts the oil supply out of the critical range. Stage 2 brings the system into a stable, thermally relieved state, with reserves for hot and diluted oil, high sustained load, and the spread across real-world engines, including their measurably lower oil temperatures.
One might object: you have the data, so just publish sample curves with all the boundary conditions attached. The honest answer to that has two parts. First, even perfectly documented sample values would immediately be read as a blanket promise all over again, "3.1 bar on test engine X under conditions Y" reliably turns into "MMHP promises 3.1 bar" once it's passed along, and then the misunderstanding starts all over, just with our name attached. Second, years of our development work sit inside these curves and their measuring positions, they're part of the know-how this company lives on, and we ask for understanding that we protect it.
¶ The price of honesty
We know this stance has a cost. A competitor who promises a clean bar figure sounds more decisive than we do with our percentages and explanations, and every so often we lose a customer to a number that customer will never be able to verify by measurement. We accept that, because the alternative would be to fake a precision that can't exist, and anyone who fibs on the first number rightly isn't believed on the rest either.
Anyone wanting to go deeper, we'd rather give the knowledge to make sense of a number than the number itself: how oil pressure actually comes about, what measuring instruments can do, why engines vary. Anyone who has read these three articles, incidentally, almost never asks the bar question again, not because it's forbidden, but because by then it's visible that it was the wrong question. The right one is: does my oil system have reserves under all conditions? And that's the question our answer has been out in the field addressing since 2015.
¶ See also
- Oil pressure isn't just oil pressure: why the measuring position matters
- Why measurements before and after a conversion can't be compared
- Every engine is a one-off: manufacturing tolerances and oil pressure
- VW T5 2.0 BiTDI (CFCA): why only Stage 2 applies there
- The Volumetric-Hydrodynamic Feed-Pressure Index (VHFI)
Transparency note: MMHP has been developing, testing and manufacturing its own products for the automotive industry for over 25 years, including solutions for the oil supply of VW TDI engines. This article explains a deliberate communication decision about our own products; the statements on pressure regulation and housing strength are based on our own testing and support experience.